I look at my competition, and they’re putting out maybe one or two posts per WEEK. Yet if my most recent post is more than two hours old, I get nervous and guilty. I spoil you people. Honestly. But I need you as much as you need me, so at least we’ve developed a really unhealthy codependency. So we’ve got that going for us.
Anyway.
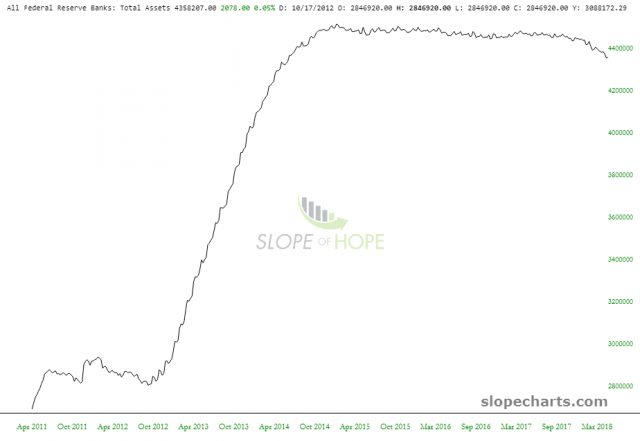
Our $21-trillion-in-debt federal “government” continues to ever-so-slow “normalize” their balance sheet. It’s kind of like watching Oprah’s weight chart. It went up really, really fast, but my God it’s coming down slowly. But it’s coming down nonetheless. Honey.
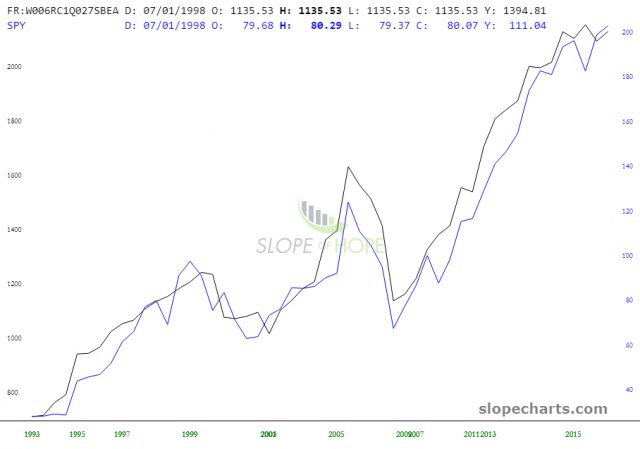
I also found this kind of interesting – – if you look at the federal tax receipts (which are at a record high) and overlay the S&P 500 – – you get virtually identical graphs! Of course, in spite of decades of evidence, this will NEVER turn down again, right?
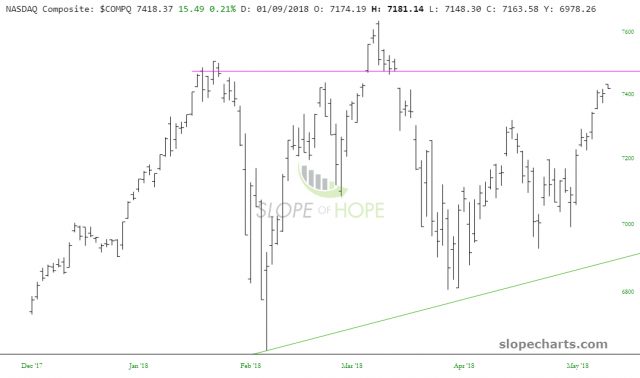
The NASDAQ Composite, in spite of all its strength, still hasn’t sealed its gap up. Maybe it never will. I hope not, at least. That would leave intact a very beautiful topping pattern.
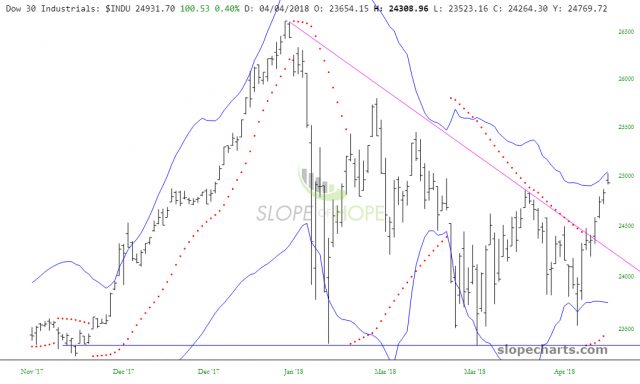
The Dow 30 has indeed broken out of its own triangle pattern, having vomited about 1500 points higher in just a matter of days. Notice how it’s mashed right up against its upper Bollinger Band, which hasn’t happened since Ulysses Grant was our President.
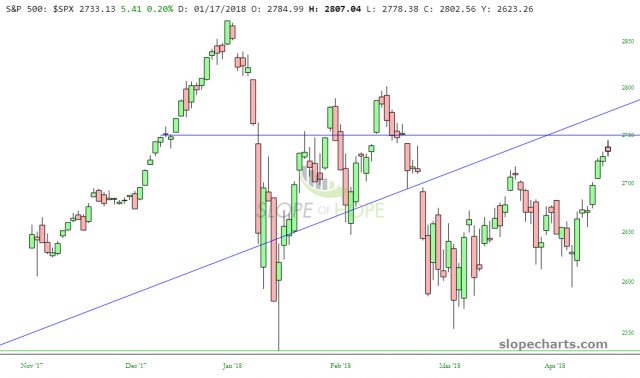
I would also like to point out that the S&P 500 didn’t get above its absolutely critical 2750 gap either.
As for my own positioning, I’m short 71 different items and have 28 others I’ve got my eye on. But, more important than anything else, is this:
