Buybacks and dividends. The mere mention of either one is often enough to make some investors’ hearts race with excitement and embolden them with confidence that company management is being a better steward of capital.
Last week I discussed the importance of core investments, focusing on debt securities such as U.S. Treasuries and quality municipal bonds. Because most economists expect the Federal Reserve to raise interest rates later this year, it might be prudent for investors to stick with short-term, quality munis right now, as they’re less sensitive to rate increases than longer-term bonds.
But just as important to building a strong portfolio are investments in companies that return capital to shareholders in the form of dividends and repurchases of shares.
$1.2 Trillion in Buybacks
Why should you care about buybacks? There are a few answers to this question, but typically a company will initiate a buyback program when its management team believes that the stock is undervalued. This suggests that the company has a lot of confidence in its own future and could signal that strong growth is ahead.
Some effects and possible ramifications of buybacks are higher earnings per share, higher stock price and lower volatility.
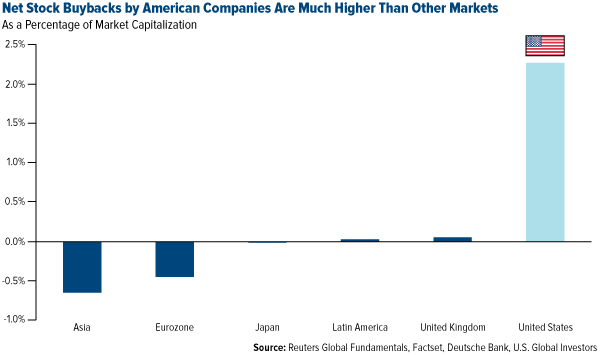
When it comes to stock buybacks, no other world market right now beats the U.S. If we look at net buybacks, which is the difference between issuances and buybacks, American companies are clearly in the lead, repurchasing over 2 percent of market cap. 
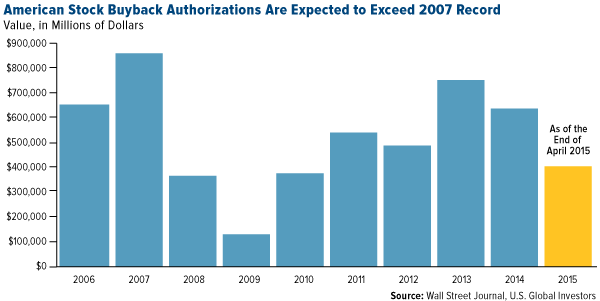
In April, a staggering $141 billion in buybacks were authorized—the most ever in a single month and an increase of 121 percent from April 2014. If this pace keeps up, a record $1.2 trillion in buybacks could be reached by year’s end, crushing the all-time high of $863 billion set in 2007. 
Leading the way is Apple (NASDAQ:AAPL). Between August 2012 and March 2015, the tech giant repurchased $80 billion of its own shares.
As for dividends, Apple has paid out $2.8 billion in each of the last four quarters, for a total of over $11 billion.
Dividends per Share at Stunning Double-Digit Growth Rates—Government Bonds at Unattractive Yields
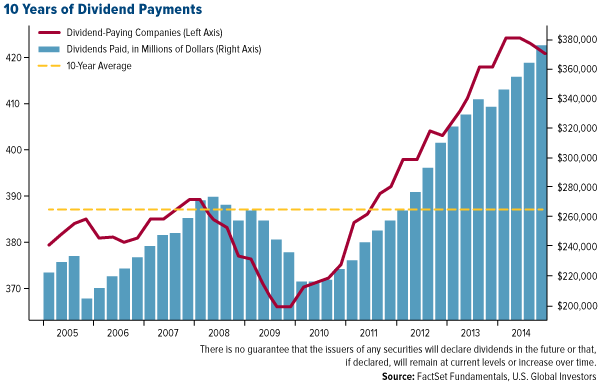
Goldman Sachs recently estimated that dividend yield will be the single largest contributor to total returns by the end of this year. It’s easy to see why, judging from the sheer number of companies that offer a dividend now. Apple is joined by 420 others in the S&P 500 Index that similarly reward shareholders. That calculates to an impressive 84-percent participation rate.
For the last 16 quarters, dividends per share rose at double-digit rates, and each of the last four quarters gave us a new record high in payment amounts. 
Earlier in the month I shared the fact that dividends had a 15 percent year-over-year growth rate in the first quarter. Looking ahead, dividends per share are expected to increase an additional 8.2 percent over the 12 months starting March 2015.
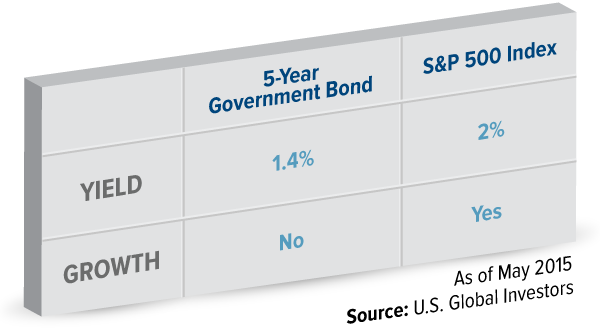
Compare these attractive figures to the 5-Year government bond. Not only is the yield lower than that of S&P 500 companies as a whole, but the 5-year doesn’t provide any growth. Stocks and Treasury bonds do have some obvious differences, though, including investment objectives, costs and expenses, liquidity and safety. 
Some of the stocks in funds we manage that currently have the highest yields are integrated energy company Entergy (NYSE:ETR) (5.12 percent), AT&T (NYSE:T) (5.44 percent), and communications provider CenturyLink (NYSE:CTL) (6.5 percent). The three also have stock buyback programs.
Airlines Top the List of Bargain Stocks
Investors might point out that the domestic equities market is expensive right now. Historically, it is. The S&P 500 is trading at 18.6 times earnings.
But there still are many potentially rewarding deals out there. Barron’s recently published its annual list of the 500 cheapest domestic stocks, which in the past have demonstrated better-than-average growth. In 2014, for instance, the 20 cheapest stocks on the list rose a combined 20.7 percent, beating the 12.6 percent the S&P companies as a whole delivered.
This year, American Airlines Group (NASDAQ:AAL) and United Continental Holdings Inc (NYSE:UAL) top the list of cheap stocks, the former trading at 5.1 times estimated earnings, the latter at 5.7. Also appearing in the top 20 are Prudential Financial Inc (NYSE:PRU), MetLife Inc (NYSE:MET), Hewlett-Packard Company (NYSE:HPQ) and Valero Energy Corporation (NYSE:VLO)—all vastly cheaper than the S&P 500.
Buying the Dip
Too often we see that investors buy into a stock or industry too late in a bull market, after much of the gains have already been made.
We saw this very thing happen when the Shanghai Composite Index tumbled 6.5 percent last Thursday, the most significant correction since January. The index has been on a tear for the 12-month period, returning over 125 percent. But between Wednesday the week before last and Wednesday last week—just one day before the correction—approximately $4.6 billion in emerging market funds around the globe were moved into China A-Shares. It was the largest weekly inflow since 2005.
We noted the Shanghai Composite bull market last September and were early participants in the rally through our exposure to China A-Shares. We also accumulated on the dip, as we expect the index to move higher.
Losing your confidence is one of the worst things that can happen when investing. We maintain our confidence by seeking companies that reward shareholders through stock buybacks and dividend payments and that trade at discounted rates.
Disclosure: Past performance does not guarantee future results.
Stock markets can be volatile and share prices can fluctuate in response to sector-related and other risks as described in the fund prospectus.
Foreign and emerging market investing involves special risks such as currency fluctuation and less public disclosure, as well as economic and political risk. By investing in a specific geographic region, a regional fund’s returns and share price may be more volatile than those of a less concentrated portfolio.
The S&P 500 Stock Index is a widely recognized capitalization-weighted index of 500 common stock prices in U.S. companies.
The Shanghai Stock Exchange Composite Index is a capitalization-weighted index that tracks the daily price performance of all A-shares and B-shares listed on the Shanghai Stock Exchange.
There is no guarantee that the issuers of any securities will declare dividends in the future or that, if declared, will remain at current levels or increase over time. Note that stocks and Treasury bonds differ in investment objectives, costs and expenses, liquidity, safety, guarantees or insurance, fluctuation of principal or return, and tax features.
All opinions expressed and data provided are subject to change without notice. Some of these opinions may not be appropriate to every investor.
