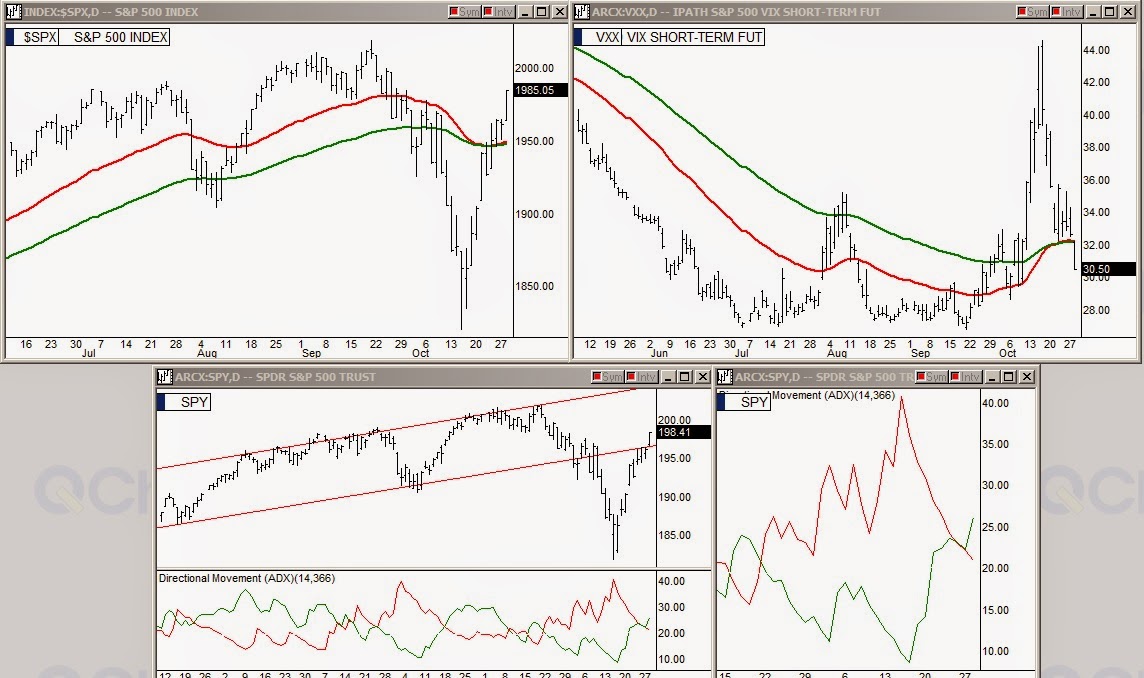
In my previous article I discussed how the drop in the iPath S&P 500 Vix Short Term Fut (ARCA:VXX) right before the close Monday might be a sign the bears were about to blink in the big EMA standoff. At Tuesday's opening it was confirmed that this was the trigger to start the S&P lifting and the VXX falling. Looking at the top chart cluster we see how the S&P began to lift in its EMA setup and the VXX had its price drop below its pair of lines Tuesday, a precursor to setup failure. In the lower charts above, the SPDR S&P 500 (ARCA:SPY) reentered its two-year bubble channel Tuesday and the ADX shows that the buyers came in fast.

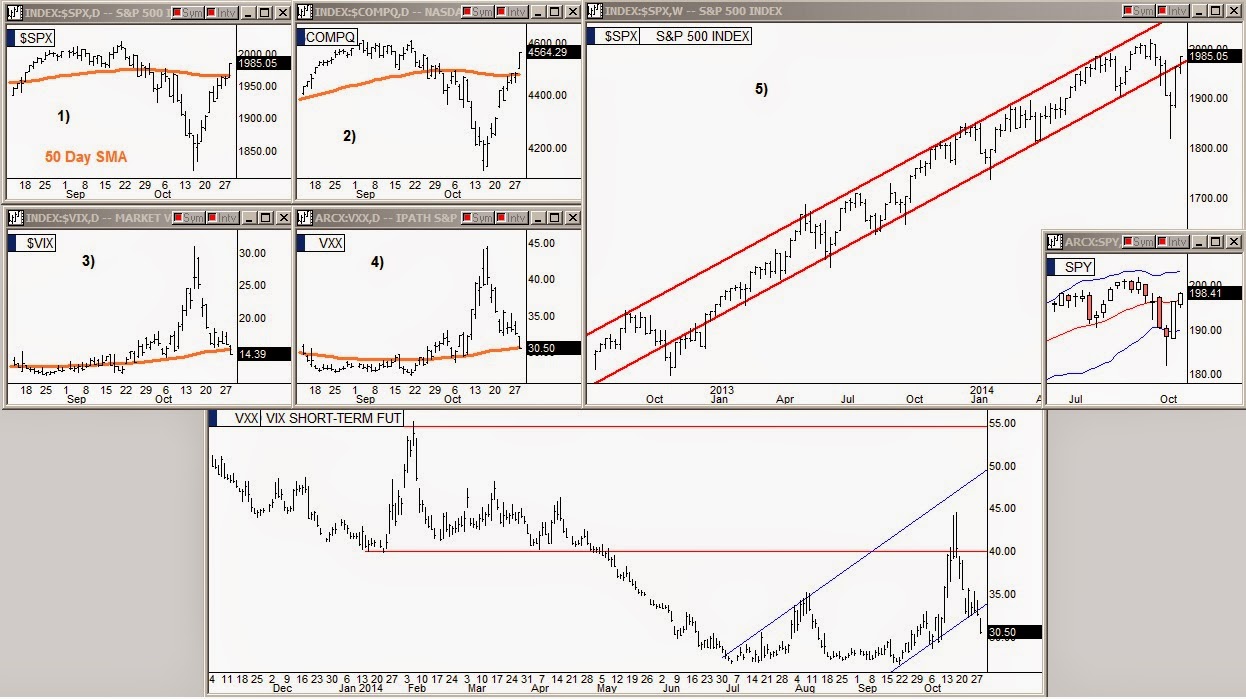
In charts 1 and 2 above we see that the S&P and NASDAQ both broke above their 50 day SMA lines Tuesday. In the small weekly candles chart inlaid on chart 5, the S&P broke above the weekly center basis line of the Bollinger Bands®. In the bottom chart we see how the VIX and VXX both fell out of their uphill channels also.

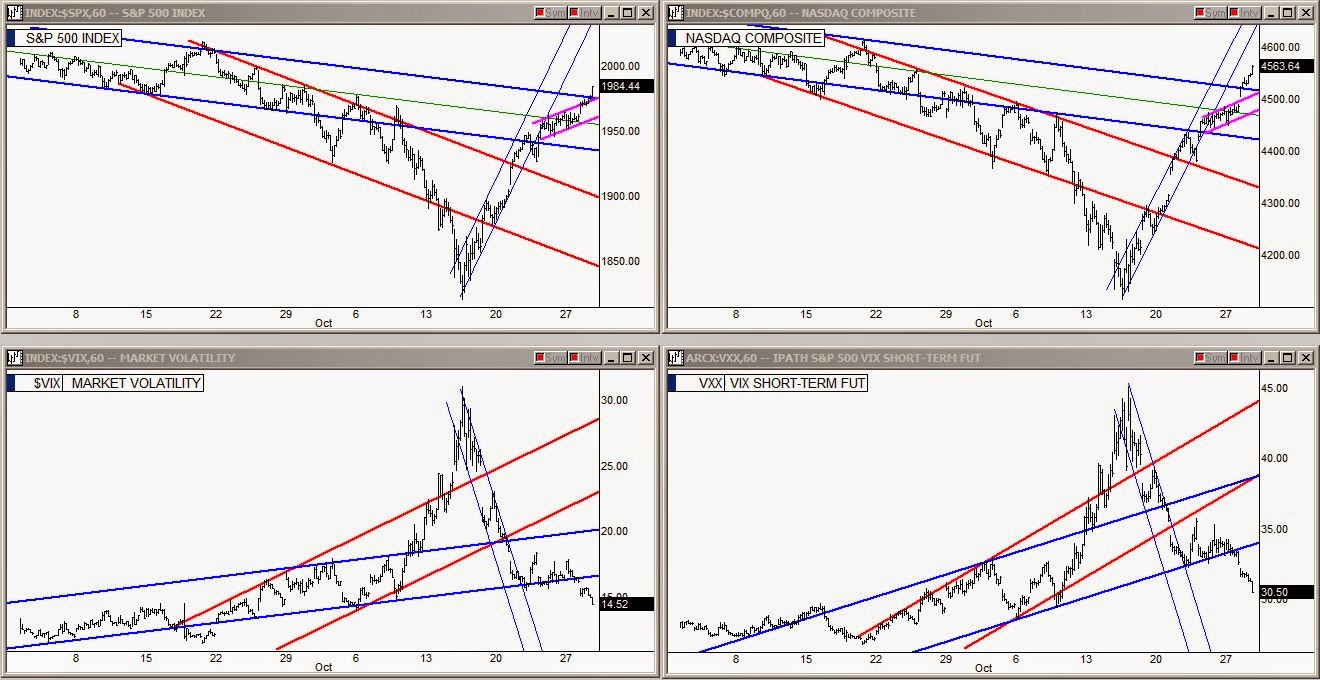
In the short term channels cluster above, we see both the VIX and VXX dropped well out of their blue channels. The S&P and NASDAQ broke out of their multi-month blue line downhill channels.
The VXX drop in the last twenty minutes before the close Monday was all the warning that was given that the standoff was about to break. If you acted quickly on it you have already made good money going long.
Wednesday afternoon is the big moment for the Fed. It will be interesting to see if they have enough market momentum going to continue on up no matter what Yellen says.
