Sellers Leave Bearish 'Inside Doji' Across Indices On Friday

Published 03/30/2020, 12:20 AM

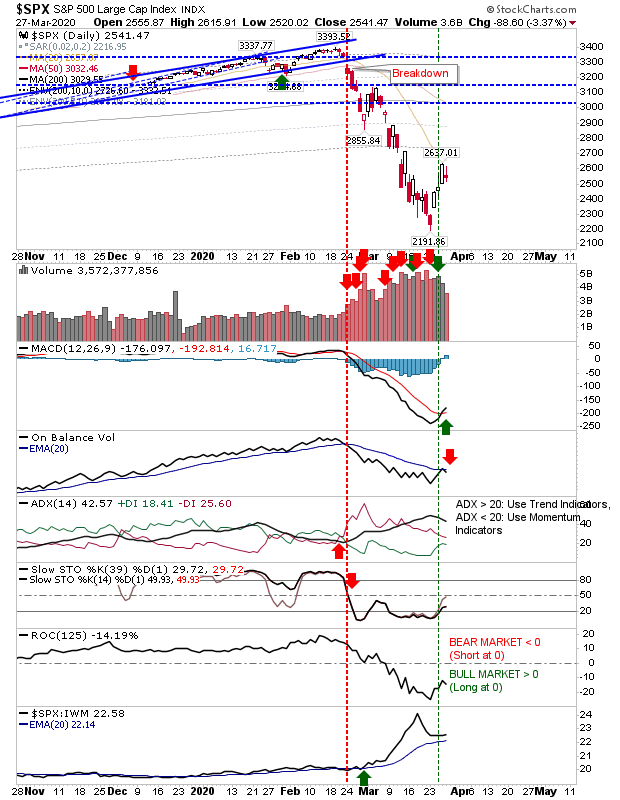
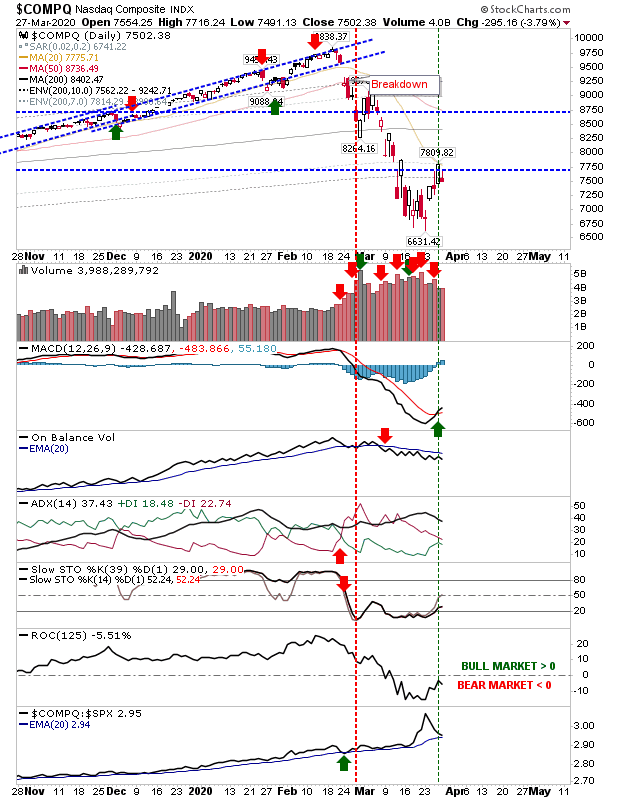
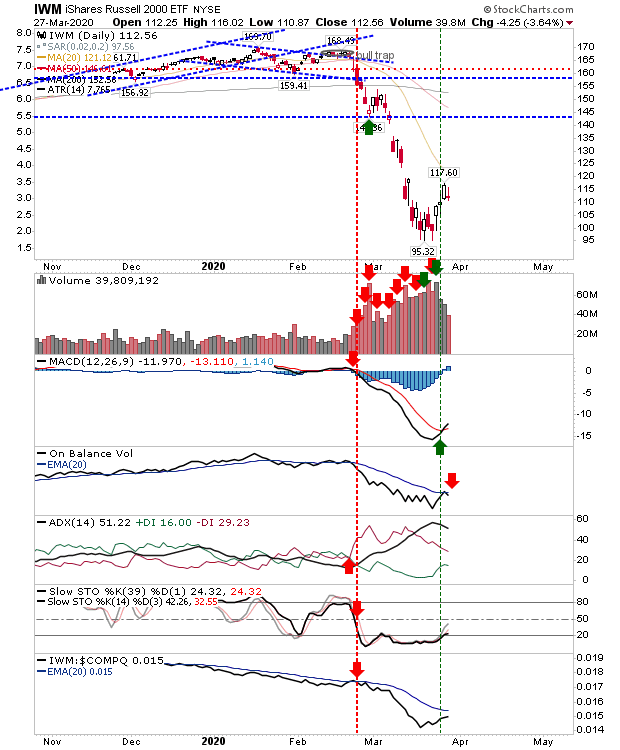
Friday saw the return of sellers which left many of the lead indices with bearish inside doji; this pattern is typically viewed as bearish when momentum indicators like Stochastics and RSI are overbought, but in the midst of this bear market, the mid-line of Stochastics is seen as overbought, and this is where we are now. In addition to this, many indices are also up against 20-day MA resistance. We are seeking a point where the bounce loses the momentum it had as it faces overhead supply from panicked, and loss-holding, bulls. The only positive from Friday was the lighter volume on the selling.

For the S&P, this convergence of bearishness has also come with a bearish cross in 'On-Balance-Volume', but still has the MACD trigger 'buy'.The question is whether this will in fact be a swing high reversal, or will the index continue higher—looking at the 50-day MA as the next supply, reversal zone.
SPX Daily Chart

The NASDAQ had already shifted towards a favored distribution trend from earlier in March, but is still holding on to its MACD trigger 'buy.' The index has been outperforming for a long time and by virtue of that, has held up well in the face of COVID-driven selling. However, it may start to underperform as other sectors offer better value.
COMPQ Daily Chart

Small Caps (via iShares Russell 2000 ETF (NYSE:IWM)) was hardest hit of the indices, but the recovery has also been one of the better ones in relative terms. Like other indices, the MACD is on a 'buy' trigger but On-Balance-Volume returned to a 'sell' trigger. Bull markets are led out by Small Caps, so we will look to see what leadership this index can provide over the coming months.
IWM Daily Chart

For the start of this coming week, we want to see rallies stabilize and consolidate and then see how retest of lows emerge. While the bounce isn't over it has reached a natural reversal point—the question is, will it?

Latest comments

Loading next article…
Risk Disclosure: Trading in financial instruments and/or cryptocurrencies involves high risks including the risk of losing some, or all, of your investment amount, and may not be suitable for all investors. Prices of cryptocurrencies are extremely volatile and may be affected by external factors such as financial, regulatory or political events. Trading on margin increases the financial risks.
Before deciding to trade in financial instrument or cryptocurrencies you should be fully informed of the risks and costs associated with trading the financial markets, carefully consider your investment objectives, level of experience, and risk appetite, and seek professional advice where needed.
Fusion Media would like to remind you that the data contained in this website is not necessarily real-time nor accurate. The data and prices on the website are not necessarily provided by any market or exchange, but may be provided by market makers, and so prices may not be accurate and may differ from the actual price at any given market, meaning prices are indicative and not appropriate for trading purposes. Fusion Media and any provider of the data contained in this website will not accept liability for any loss or damage as a result of your trading, or your reliance on the information contained within this website.
It is prohibited to use, store, reproduce, display, modify, transmit or distribute the data contained in this website without the explicit prior written permission of Fusion Media and/or the data provider. All intellectual property rights are reserved by the providers and/or the exchange providing the data contained in this website.
Fusion Media may be compensated by the advertisers that appear on the website, based on your interaction with the advertisements or advertisers.
© 2007-2025 - Fusion Media Limited. All Rights Reserved.