⭐ Start off 2025 with a powerful boost to your portfolio: January’s freshest AI-picked stocksUnlock stocks

AUD Best Performer With RBA On Hold

Published 12/03/2019, 01:28 AM
EUR/USD
-
USD/JPY
-
EUR/AUD
-
AUD/CAD
-
AUD/CHF
-
AUD/JPY
-
AXJO
-
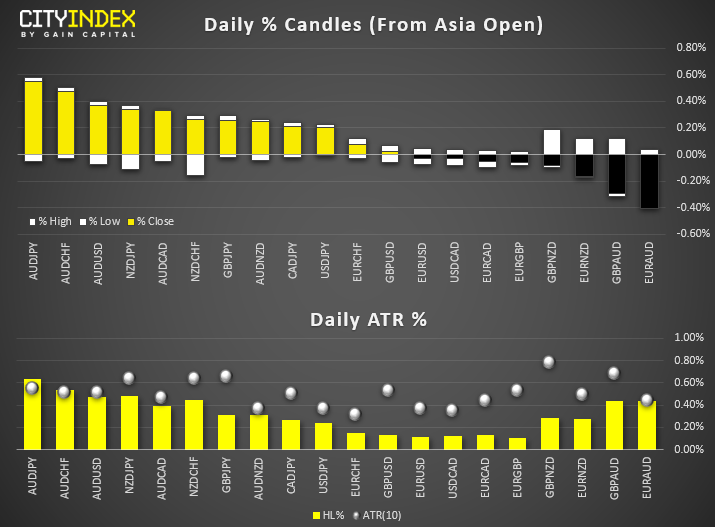
Daily % Candles

FX Brief:

  • RBA held rates at 0.75% as widely expected, although they could still b eon track to cut rates as early as Q1 2020.
  • Trump took to Twitter to again tell the Fed they need to lower rates to fend off low inflation, and combat yesterday’s weak ISM manufacturing print. Oh, and the “dollar is very strong relative to others”. Basically, cut the rates.
  • Japan’s government is preparing a $120 billion stimulus package to help kick start their lackluster economy. Whilst it’s expected to be around $120 billion initially, it could rise to $230 billion when private-sector spending is included.
  • Price Action:

  • The Australian dollar is the strongest major after the RBA held rates, and AUD/JPY is the largest gainer of the session. Take note that AUD/CHF and AUD/JPY have exceeded their ATR’s so further upside could become limited in later sessions.
  • The USD dollar has pared some of yesterday’s losses but, due to depth of the original declines, suspect these moves to be corrective and pave the way for further new lows this week.
  • EUR/USD is eyeing up a break of 1.1093 resistance, although we may not have the data to see it today unless ECB members speaking between 8-9am GMT feel compelled to strengthen the Euro…
  • USD/JPY has pulled back towards 109 but bears could look to fade into the 109 – 109.30 area. A break beneath 108.90 assumes further downside.
  • AUD/CAD continues to carve out a potential inverted head and shoulders pattern on the daily chart, although we’d need to see a break above 0.9145 to confirm.
  • EUR/AUD has broken support around 1.6200 and favors further downside over the near-term (again, keep ECM members on the radar.)
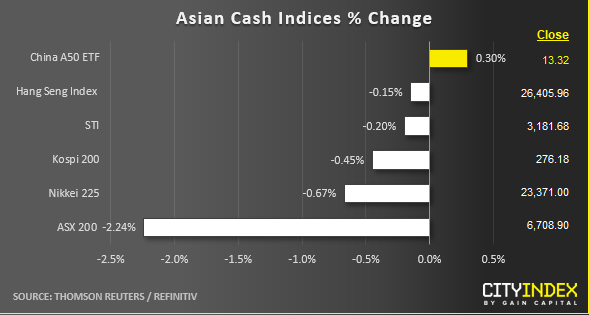
  • Asian Cash Indices % Change

    Equity Brief:

  • The performances of most key Asian stock markets have fared better versus the U.S. benchmark stock indices where they have recorded losses between -0.90% to -1.10% except for Australia’s ASX 200.
  • U.S. President Trump has upped the ante again on U.S. “hostile” global trade policy where the U.S. administration has reinstated steel tariffs on Brazil and Argentina imports and proposed new levies on France.
  • The closure of the Phase One U.S-China trade deal has become more complicated with the recent support from U.S. towards the Hong Kong’s anti-government protesters. China has hinted more retaliation measures via state media that the Chinese government will soon publish a list of “unreliable entities” that can lead to sanctions against U.S. companies from disputes over human rights in Hong Kong and Xinjiang.
  • Australia’s ASX 200 is the worst performer so far with a decline of -2.20%, the worst intraday loss in 9 days since 20 Nov 2019 after a fresh all-time high of 6893 printed on 29 Nov 2019. Leading the loss are Technology and Consumer Non-Cyclicals sectors where both have tumbled by -3.49% and -3.40% respectively.
  • The S&P 500 E-Mini futures has staged a modest recovery of 0.20% in today’s Asian session to trade close to its current intraday high of 3121.
  • Price Action (derived from CFD indices):

  • Japan 225: Yesterday’s slide from 02 Dec Asian session high of 23596 has managed to find support at 23070 which is the lower boundary of the ascending channel in place since 26 Aug 2019 low. In today’s Asian session, the Index has staged a push up, backed above 23300; the former minor swing low of 26 Nov/29 Nov 2019. Overall, no clear signs of a bearish breakdown yet.
  • Hong Kong 50: The Index has dropped and reached the 26200 support; the lower boundary of the ascending range configuration in place since 15 Aug 2019 low. Right now, as long as there is no hourly close below 26200, the Index may see a minor rebound towards the 26600/740 intermediate resistance in first step.
  • Australia 200: Reintegrated below the 6780; the former range resistance from 20 Sep 2019 high which indicates the last week’s up move was a failure bullish breakout. Right now, at risk of further potential downside to retest the range support of 6630.
  • Germany 30: Declined by -1.9%, the worst daily loss since 02 Oct 2019 and broke below the recent 21 Nov swing low of 13050. At risk of further downside towards the next near-term support at 12800 (31 Oct 2019 minor swing low & 38.2% Fibonacci retracement of the up move from 03 Oct low to 19 Nov 2019 low).
  • US SP 500: The sell-off of 1.5% from yesterday’s Asia session all-time high of 3158 has managed to find support at 3110 (the gapped up from 22/25 Nov 2019 & the lower boundary of the ascending channel from 03 Oct 2019 low). Bulls need to clear above 3140 (former minor swing low of 30 Nov & 61.8% Fibonacci retracement of yesterday’s slide) to increase the odds for a continuation of the impulsive up move sequence.
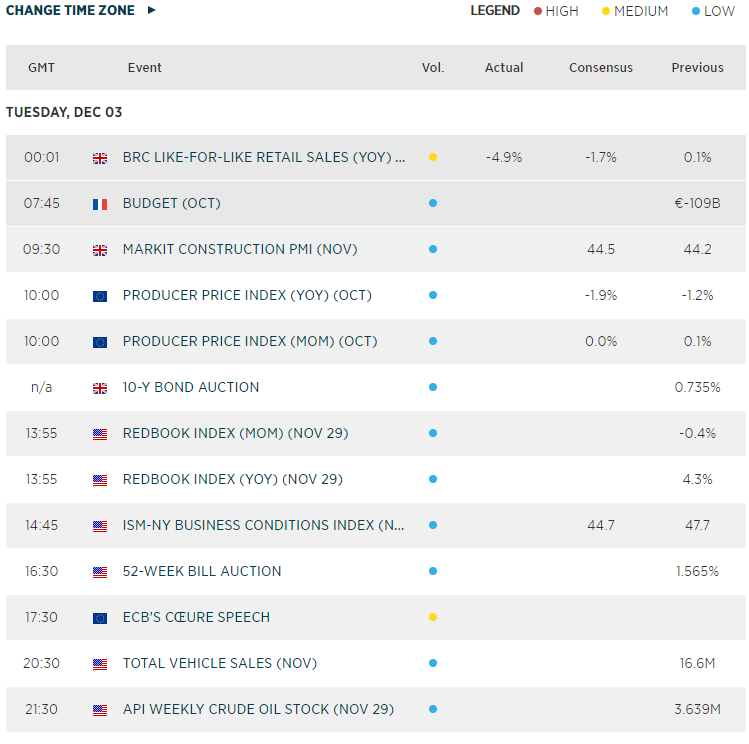
  • Economic Calendar

    Calender

    Original Post

    Latest comments

    Loading next article…
    Risk Disclosure: Trading in financial instruments and/or cryptocurrencies involves high risks including the risk of losing some, or all, of your investment amount, and may not be suitable for all investors. Prices of cryptocurrencies are extremely volatile and may be affected by external factors such as financial, regulatory or political events. Trading on margin increases the financial risks.
    Before deciding to trade in financial instrument or cryptocurrencies you should be fully informed of the risks and costs associated with trading the financial markets, carefully consider your investment objectives, level of experience, and risk appetite, and seek professional advice where needed.
    Fusion Media would like to remind you that the data contained in this website is not necessarily real-time nor accurate. The data and prices on the website are not necessarily provided by any market or exchange, but may be provided by market makers, and so prices may not be accurate and may differ from the actual price at any given market, meaning prices are indicative and not appropriate for trading purposes. Fusion Media and any provider of the data contained in this website will not accept liability for any loss or damage as a result of your trading, or your reliance on the information contained within this website.
    It is prohibited to use, store, reproduce, display, modify, transmit or distribute the data contained in this website without the explicit prior written permission of Fusion Media and/or the data provider. All intellectual property rights are reserved by the providers and/or the exchange providing the data contained in this website.
    Fusion Media may be compensated by the advertisers that appear on the website, based on your interaction with the advertisements or advertisers.
    © 2007-2025 - Fusion Media Limited. All Rights Reserved.