EU equities continued cheering China’s measures to contain the coronavirus, but the sentiment was turned upside down during the Asian morning today, as Apple (NASDAQ:AAPL) warned of lower revenue and iPhone shortages due to the virus. In the FX world, the Aussie was among the big losers. Apart from the risk-off trading, it also felt the head of the dovish minutes from the latest RBA gathering.
APPLE WARNINGS TURN MARKET SENTIMENT UPSIDE DOWN
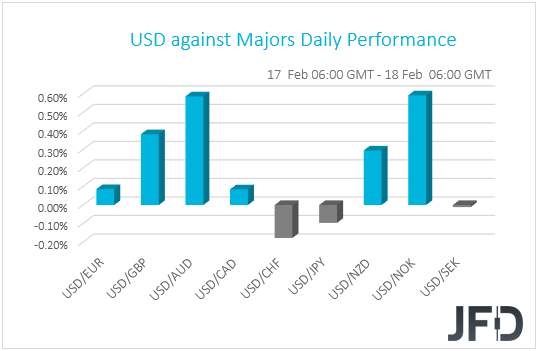
The dollar traded higher against most of the other G10 currencies on Monday and during the Asian morning Tuesday. It gained against NOK, AUD, GBP, NZD, CAD and EUR in that order, while it underperformed only against CHF and JPY. The greenback was found virtually unchanged versus SEK.
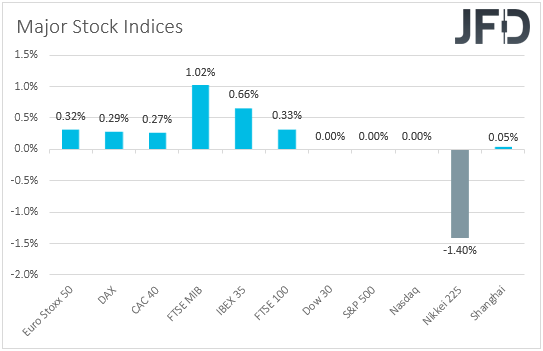
The strengthening of the safe-havens and the weakening of the risk-linked currencies suggest that once again the broader market sentiment took a 180-degree turn, from risk-on to risk-off. Indeed, although EU markets continued cheering China’s measures to contain the coronavirus, the majority of Asian bourses traded in the red today. Although China’s Shanghai Composite finished virtually unchanged (+0.05%), Japan’s Nikkei 225 fell 1.40%. US and Canadian markets stayed closed yesterday in celebration of Washington’s Birthday and the Family Day respectively.
What spooked investors overnight were warnings by US technology giant Apple, which flagged lower revenue and iPhone shortages due to the fast-spreading coronavirus, adding that it may not meet its guidance for the 1st quarter of 2020. What’s more, South Korea President Moon Jae-in declared an economic emergency, with the nation’s stock market falling 1.48%. At this point we need to note that Asian investors may have also been cautious due to Japan’s GDP data on Monday revealing contraction for the last quarter of 2019. With the uncertainty surrounding the virus casting shadows over the nation’s economic performance for Q1, it seems that Japan looks to be headed towards a recession.

Overnight, there was reported another slowdown in both infected cases and deaths from the virus, but China’s state assets regulator said that the impact on industries would mainly appear in February. This suggests that despite the slowdown, the worst – at least in terms of economic impact – may not be behind us yet. On top of that, the World Health Organization warned that with regards to the virus’s evolution, “every scenario is still on the table”. In our view, the message here is that it is too early to say that the virus has been contained. Yes, China adopted tough restrictions in terms of no travel and movement, but this is at a great cost to its economy. Imagine if those measures are not enough and the virus starts spreading at an accelerating pace again. More measures would need to be introduced, something that would add more credence to our view that the economic wounds could well drag into Q2.
NIKKEI 225 – TECHNICAL OUTLOOK
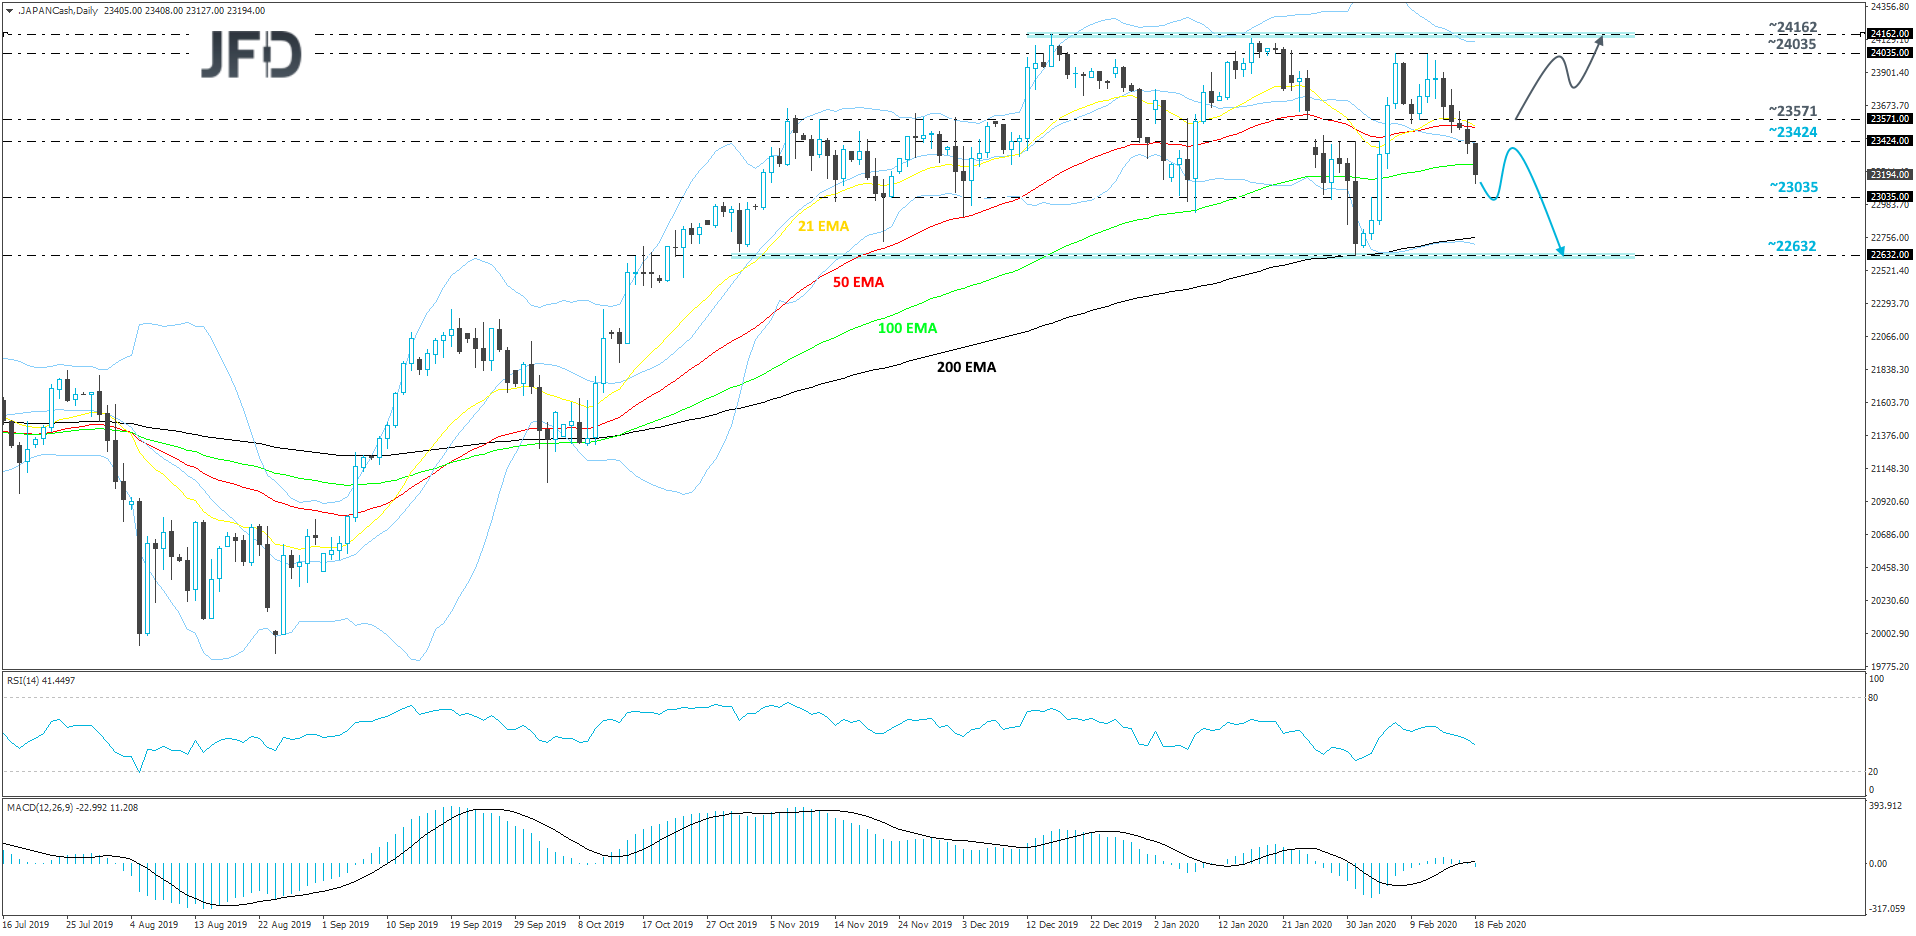
From around the end of October 2019, the Nikkei 225 index continues to trade within a wide range, roughly between the 22632 and 24162 levels. After failing to test the upper bound of that range in the beginning of February, the index fell under some selling pressure and is now drifting lower. Judging by the recent price action and our oscillators, we may see a bit more downside in the near term, hence why we will take a somewhat bearish approach for now.
A further drift south could lead to a test of the inside swing high, which was formed on February 3rd, at 23035. There might be a chance to see a bit of a hold-up around there, or it may even help the buyers to lift the index back up a bit. However, if the bulls find it too difficult to overcome the 23424 zone, this could lead to another round of selling. If this time the 23035 fails to provide good support and breaks, such a move might send Nikkei 225 to the lower side of the aforementioned range, at 22632.
On the other hand, if the price manages to climb above the previously-discussed 23424 area and then makes its way above the 23571 barrier, this could attract a few more buyers into the game. Such actions could help raise Nikkei 225 to the current highest point of February, at 24035, which if broken may send the index to the 24162 level. This is the upper end of the range and is also marked by the highest point of 2019.
RBA DISCUSSED CUTTING RATES LAST TIME IT MET
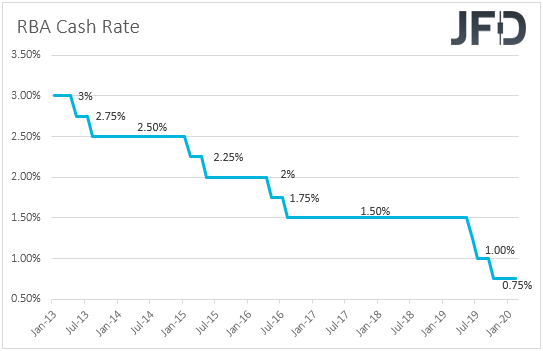
Back to the currencies, the Aussie was among the main losers. Apart from the switch to risk-off, the Australian currency may have also felt the heat of the minutes from the latest RBA monetary policy gathering. At that meeting, the Bank decided to keep interest rates unchanged at 0.75%, while the statement accompanying the decision was less dovish than anticipated, with officials repeating that the long and variable lags in the transmission of monetary policy allowed them to keep rates steady, although they remained prepared to ease further if needed.
Having said that though, the minutes revealed that the board discussed the case of easing even at that gathering, adding that a further rate cut could speed the progress towards the employment and inflation targets. Moreover, although in the statement they noted that the effects of the bushfires and the coronavirus on the domestic economy will be temporary, in the minutes, it was noted that it is too early to judge the virus’s impact and that it consists a material risk to the Australian economy. Officials also noted that accelerating wage growth would be a welcome development, though that’s not something to be seen over the next couple of years.
Focus for AUD-traders now turns to the Wage Price Index for Q4. The index is forecast to have grown at the same pace as in Q3 (+0.5% qoq), which would keep the yoy rate steady at +2.2%. However, with headline inflation ticking up to +1.8% yoy during the quarter from +1.7% in Q3, this means that real wages may have slowed and thus, a steady wage rate may not be a so pleasant development for RBA policymakers, and thereby prompt market participants to bring forth the timing of when they expect the Bank to deliver another quarter-point decrease. According to the ASX 30-day interbank cash rate futures implied yield curve, such a move is still nearly fully priced in for September.

As far as the Aussie is concerned, speculation that the RBA may cut sooner than previously anticipated, combined concerns over the coronavirus’s impact on the domestic economy, may keep the currency under selling interest for a while more. As we noted several times in the past, during periods of risk aversion, we prefer to exploit any Aussie weakness against JPY and CHF, which tend to attract safe haven flows.
AUD/JPY – TECHNICAL OUTLOOK
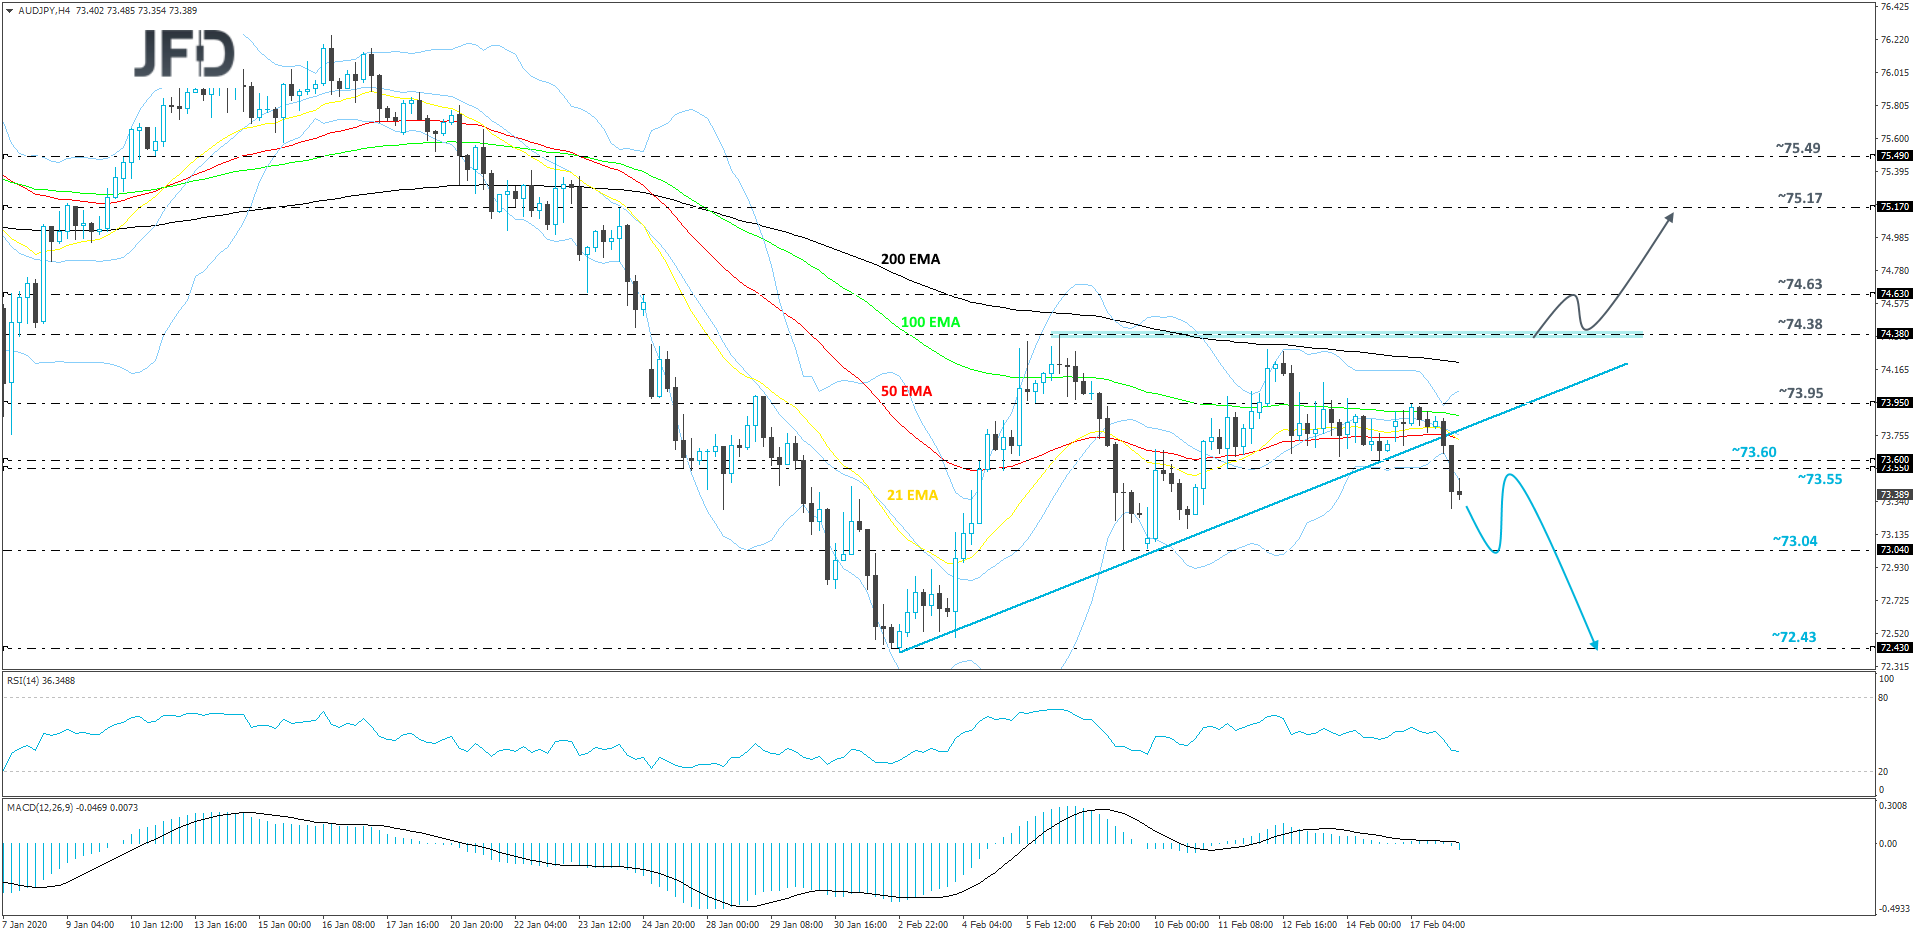
Yesterday, AUD/JPY broke below the lower side of the ascending triangle, which it started forming from the beginning of February. This move indicated that there might be a bit more downside to come. The pair also fell below its key support zone between the 73.60 and 73.55 levels, which adds a bit more bearishness to the whole near-term outlook. For now, we will remain somewhat bearish and target slightly lower areas.
A further move down could bring the pair to the 73.04 hurdle, near the lows of February 7th and 9th. That territory might initially provide a bit of support, from which AUD/JPY could rebound slightly. That said, if the rate struggles to move back above the 73.60 barrier, marked by the low of February 14th, this could result in another round of selling. If this time the pair breaks the 73.04 obstacle, this may lead it to the current lowest point of January, at 72.43.
In order to get a bit more comfortable with the upside, at least in the short run, we will wait for a push above the 74.38 barrier first. That area is the current highest point of February and also the upper side of the previously-mentioned ascending triangle. If we do see such an uprise, the next resistance zone to consider is the 74.63 obstacle, which if broken could send AUD/JPY all the way to the 75.17 level. That level marks the high of January 24th.
AS FOR TODAY’S EVENTS
During the European morning, the UK employment report for December is due to be released. The unemployment rate is forecast to have held steady at its 45-year low of 3.8%, while average weekly earnings including bonuses are expected to have slowed to +3.0% yoy from +3.2%. The excluding bonuses rate is anticipated to have ticked down to +3.3% yoy from 3.4%. According to the IHS Markit/KPMG & REC Report on Jobs for the month, starting salaries for both permanent and temporary staff accelerated somewhat from November’s lows, which suggests that the risks surrounding earnings may be tilted somewhat to the upside.
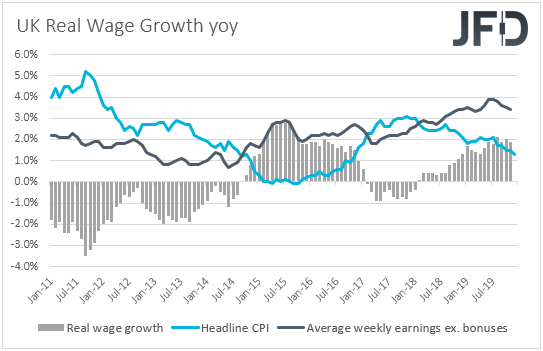
Accelerating wages may be a welcome development for BoE policymakers and may alleviate some pressure for cutting rates, especially after the resignation of Sajid Javid as Finance Minister, which triggered speculation of more fiscal support. However, as we noted in the past, our view is that they may place more emphasis on data pointing how the economy has been performing in the post-election era before deciding how to move forward. After all, they clearly pointed out at the latest meeting that they will wait for data to confirm the positive signals from recent indicators, with inflation taking the 1st place on the list. Thus, we expect Wednesday’s CPIs and Thursday’s retail sales for January to attract much more attention.
From Germany, we have the ZEW survey for February. The current conditions index is expected to have slid slightly further into the negative territory, to -10.0 from -9.5. This would mark the 7th straight month with a negative sign. The economic sentiment index is also expected to have declined to 22.0 from 26.7. This data may reveal how the coronavirus has affected sentiment in Eurozone’s economic powerhouse and may be an early omen with regards to which direction Friday’s PMIs may come in.
As for tonight, during the Asian morning, apart from Australia’s Wage Price Index for Q4, we also get Japan’s trade balance for January, with the nation’s trade deficit expected to have widened remarkably, to JPY 1695bn from JPY 154.6bn. This would mark the largest deficit since January 2014.
As for the speakers, we have only one on today’s agenda: Minneapolis Fed President Neel Kashkari.
