It was an uneventful options expiration day, with the S&P 500 finishing up 35 bps and the Invesco QQQ Trust (NASDAQ:QQQ) 'Qs' finishing flat. Meanwhile, the VVIX was flat while the VIX fell, and the SPDR® S&P Biotech ETF (NYSE:XBI) was smashed again. The market was indeed making little sense.
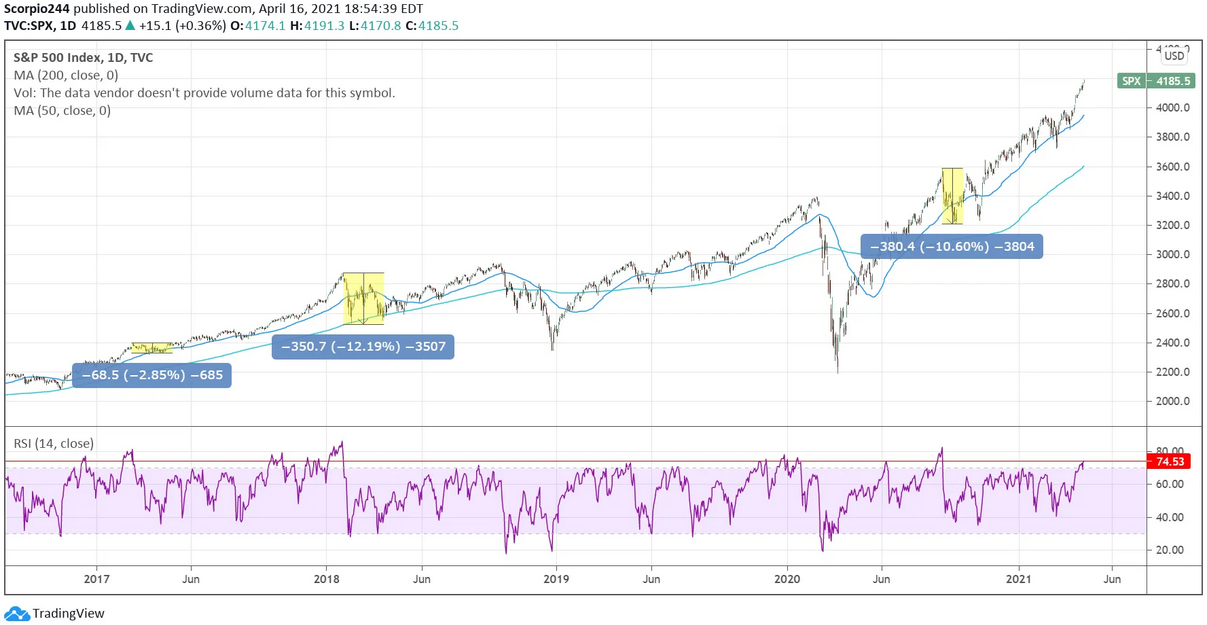
The S&P 500 remained overbought on an RSI basis, and I’m saying it because I think the index is overbought; I am saying it because the index is actually overbought. The RSI was at 74.5 and above an overbought level of 70. Does it mean that the index has to fall sharply in this instant? No. The RSI rose to over 80 in September, and it rose to almost 90 in January 2018. So by some measures, the index can grow even more overbought.
So what does it mean? Well, it means there is a pretty good chance of a very sharp correction. Certainly, we could see a drop of 12% as seen in January 2018 or a more than 10% drop in September 2020. Or we could have nothing really happen like in January 2020, even though the bottom did eventually fall out a month later.
We use indicators to tell us the measurement to get a sense of where the market is, and it is overbought.
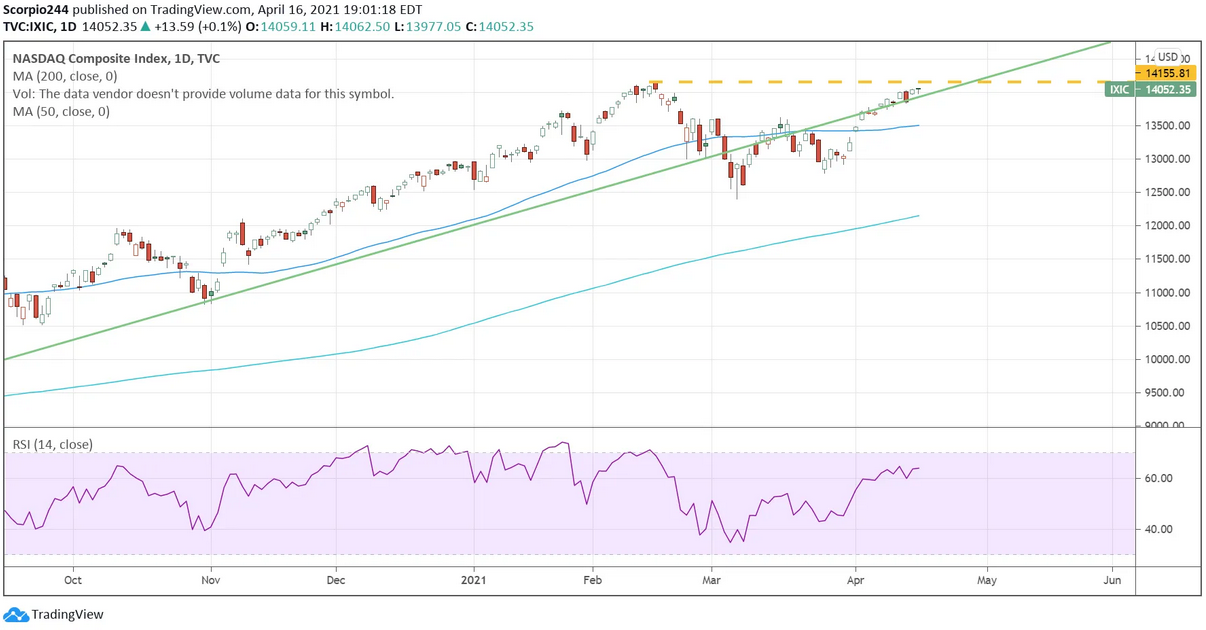
I guess what is interesting and something we don’t pay enough attention to is the NASDAQ Composite. Because despite the S&P 500 and the Dow reaching new highs, the NASDAQ composite has not. It has left me to wonder if there is something else going on here; and that the giant race higher the past two weeks doesn’t result in a series of lower highs in several stocks and potentially signaling a big turning point for the market.
Amazon
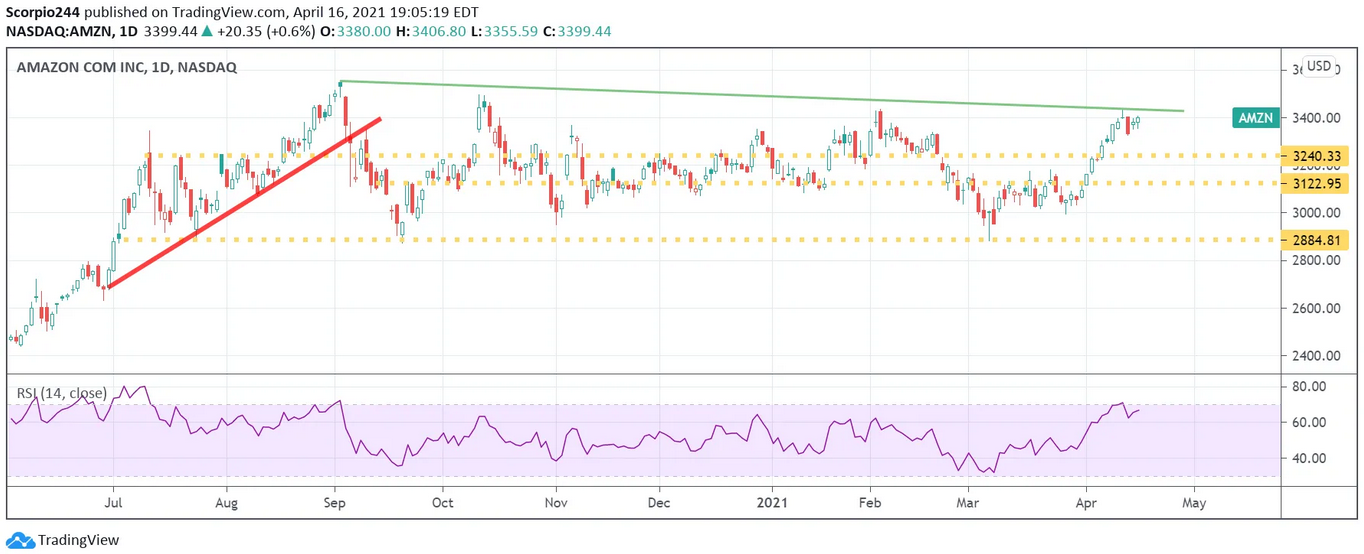
For example, Amazon (NASDAQ:AMZN) hasn’t made a new high, and one can ask if Amazon is making a lower high right now.
Apple
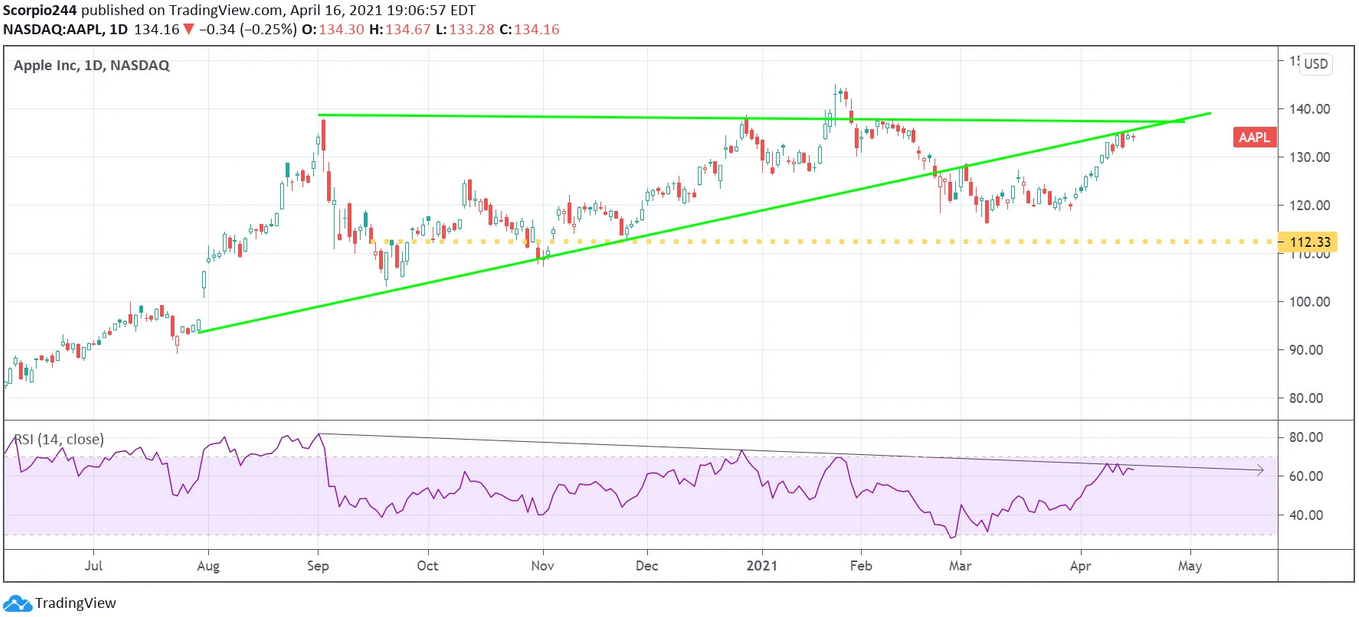
Meanwhile, Apple (NASDAQ:AAPL) hasn’t made a new high either, and like Amazon, it could be making a lower high as well.
Goldman Sachs
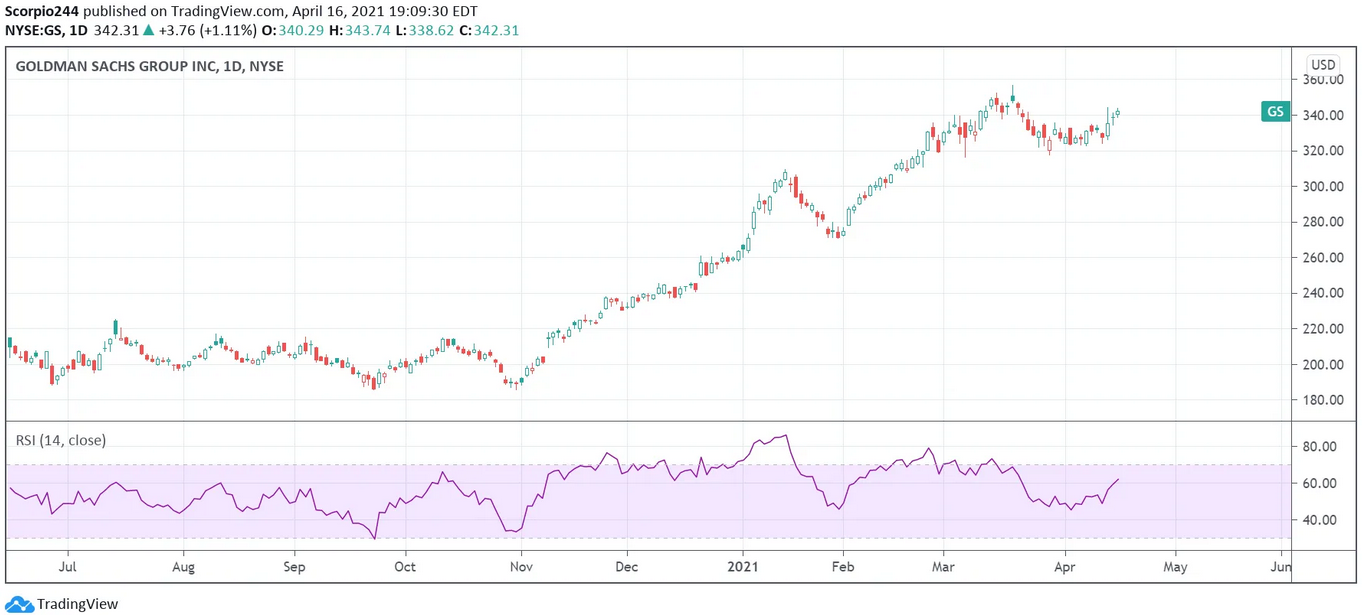
Goldman Sachs (NYSE:GS) has yet to make a new high, too, despite results that blew away expectations.
Exxon Mobil
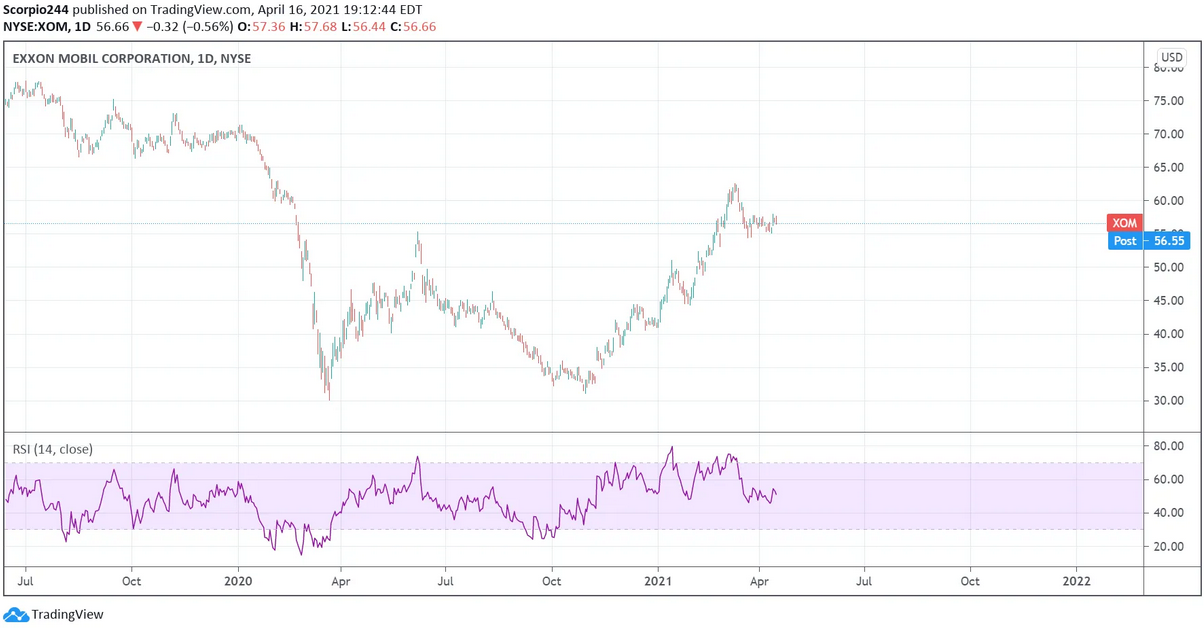
Exxon Mobil (NYSE:XOM) hasn’t made a new high.
Micron
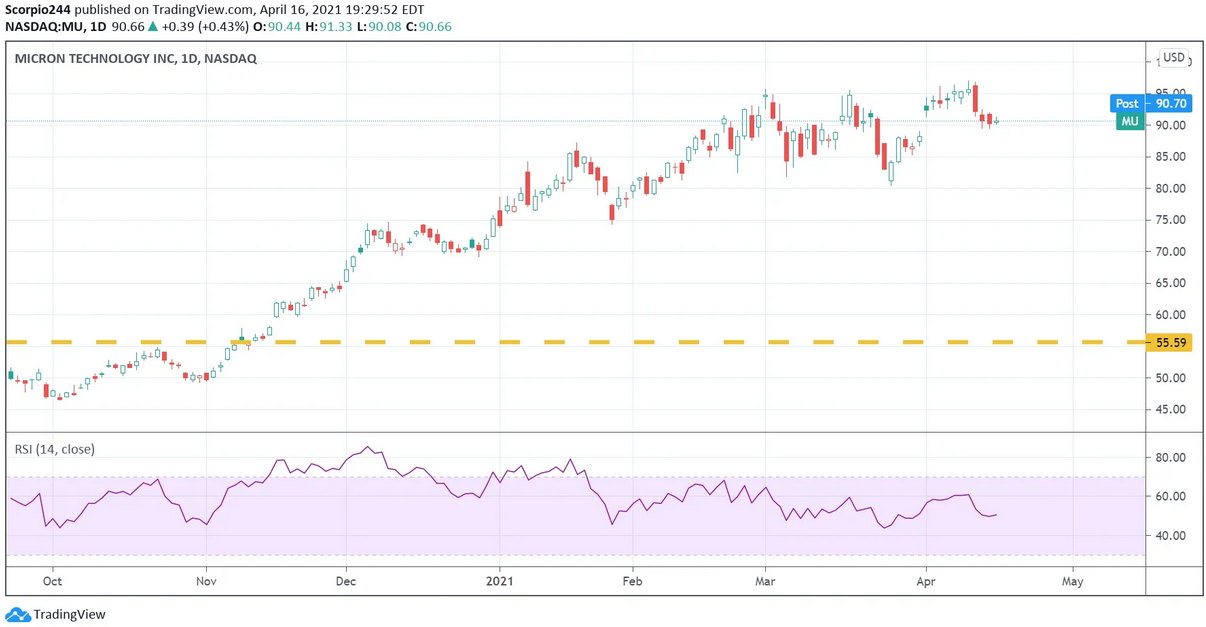
Meanwhile, Micron Technology (NASDAQ:MU), along with several semis, has struggled during this most recent run higher. In fact, Micron looked as if it was forming a triple top.
I’m sure if we looked hard enough, there are plenty of companies making new highs. But the broader and more basic question is if this recent rally is nothing more than a head fake as deeper problems lie below the surface.
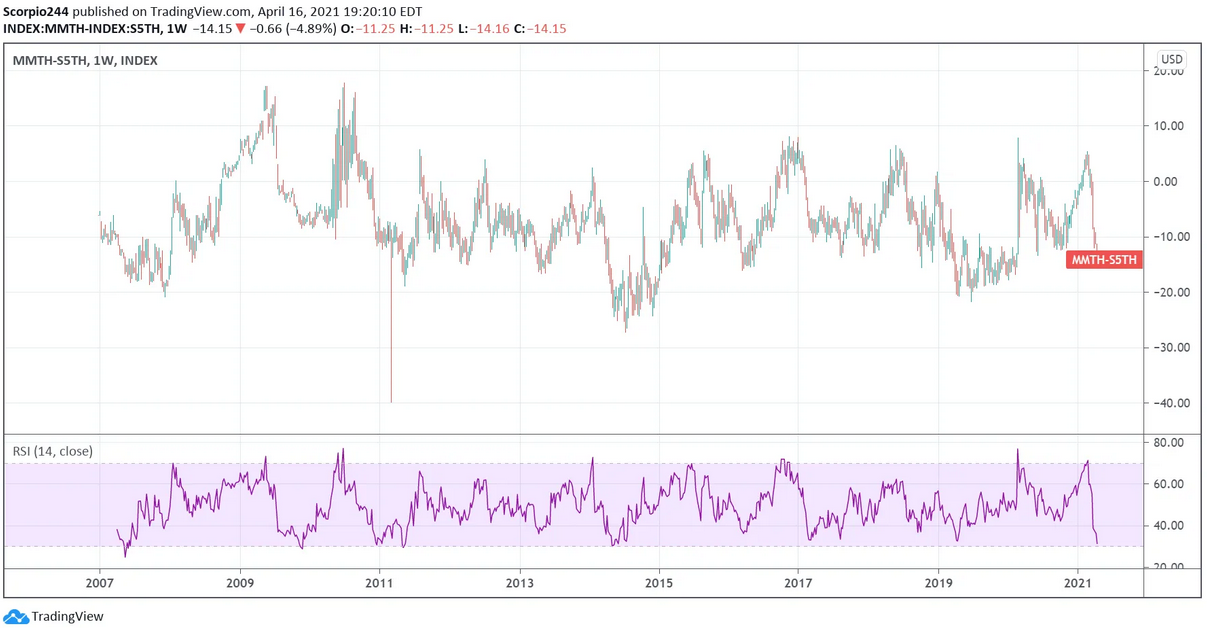
The number of stocks above their 50-day moving average in the S&P 500 is at 91.6%. The number of stocks in the total stock market above their 50-day moving average is 58.4%. The difference between the two is its widest ever.
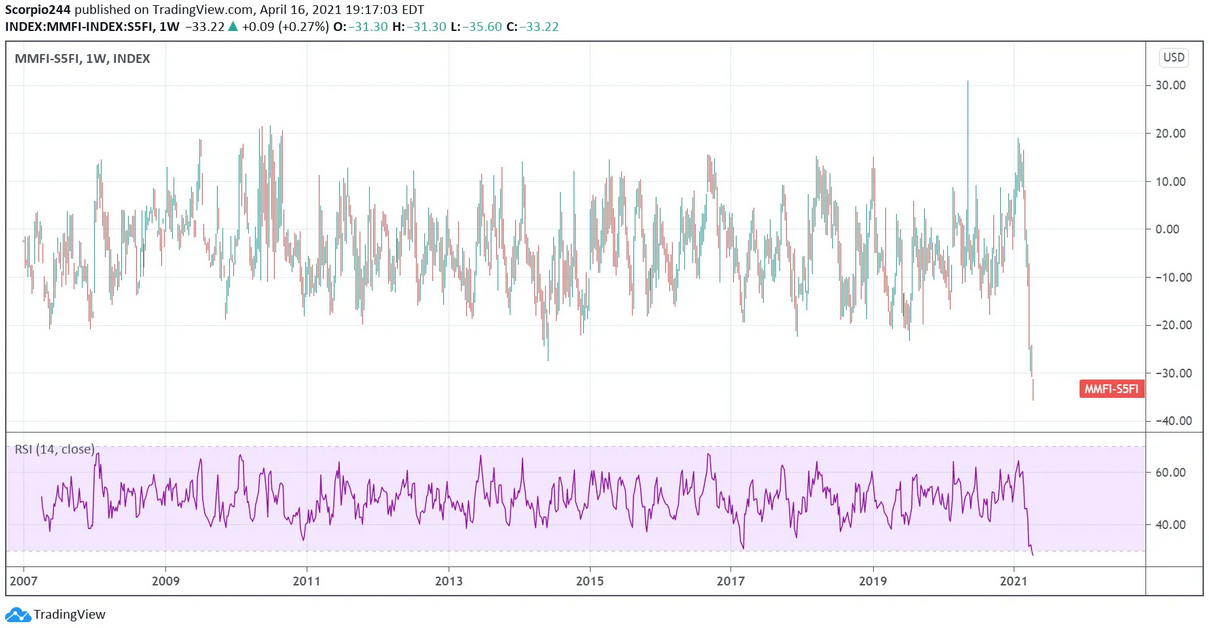
Meanwhile, the number of stocks above their 200-day moving average in the S&P 500 is at 96.6%, while the number of stocks in total above their 200-day moving average is at 82.5%. Certainly, not its widest spread ever, but very much at the low end of the range.
Anyway, something to think about over the week; I don’t have the answers, just sharing some observations.
