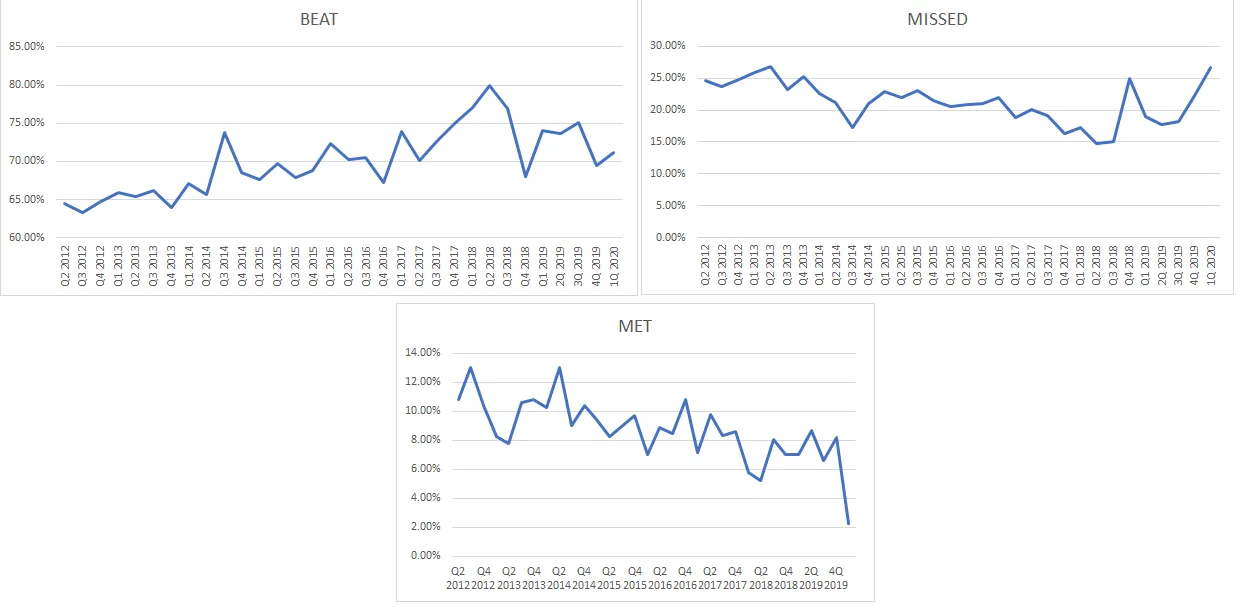
It isn’t just the economy that continues to melt; earnings estimates are melting even faster. With earnings season now about to get underway, we are going to find out a lot about the health of the equity market. It is early in the season, and according to S&P Dow Jones, just 8.9% of companies in the S&P 500 have reported results so far. Of those, 71.1% have topped estimates, 26.7% have missed, and just 2.2% have met.
The number of companies beating estimates is pretty much in line with historical trends. The number of companies missing estimates is very high. This will be the most important aspect to watch as this month moves forward.
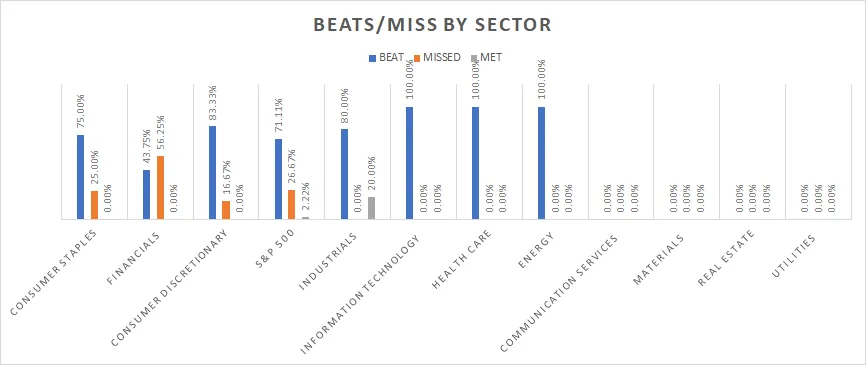
So far, 24.2% of consumer staples companies have reported with 75% beating estimates. Meanwhile, 24.2% of financials have reported with 56.2% missing estimates. The other groups are too early to tell.
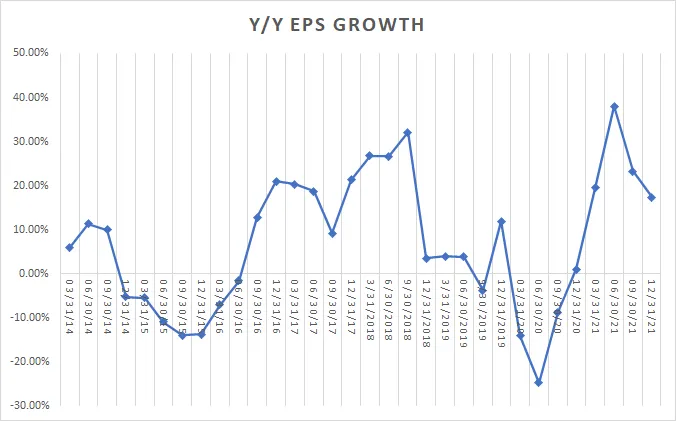
Melting
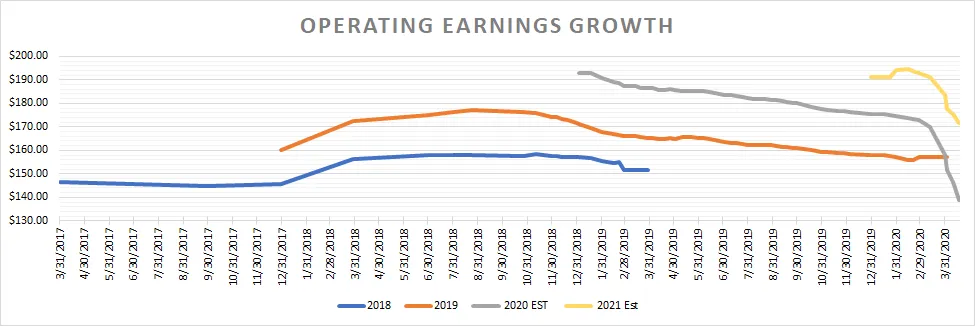
Regardless, first-quarter earnings are now estimated to drop by 14.1% to $32.62 per share. Even worse, second-quarter earnings are forecast to fall by 24.8%, and not getting back to breakeven until the fourth quarter.
The reason we care about earnings so much is that the S&P 500 mirrors those earnings nearly perfectly. The only part that changes is the sentiment around earnings. In other words, the expansion or contraction of the “P/E” multiple.
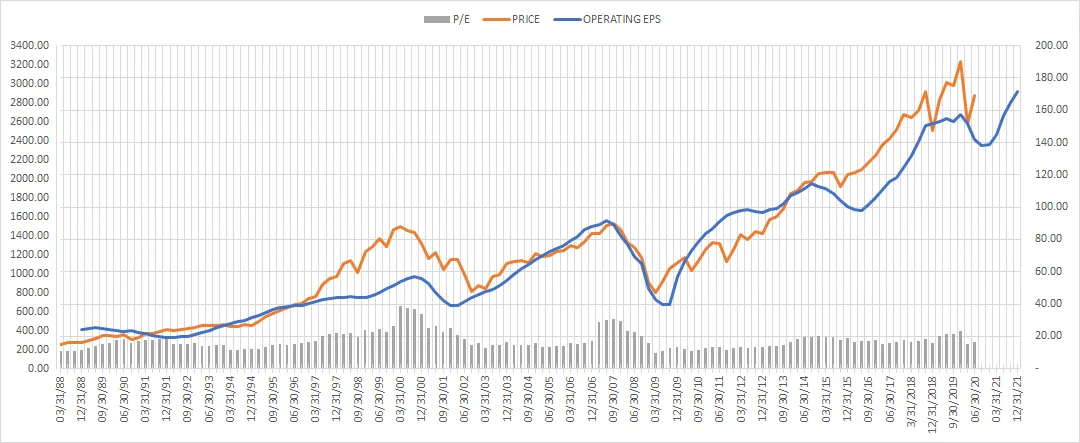
Those earnings tend to follow the broader US GDP. Tell me which way the economy is heading, I can tell you the direction of earnings, and of course the stock market.
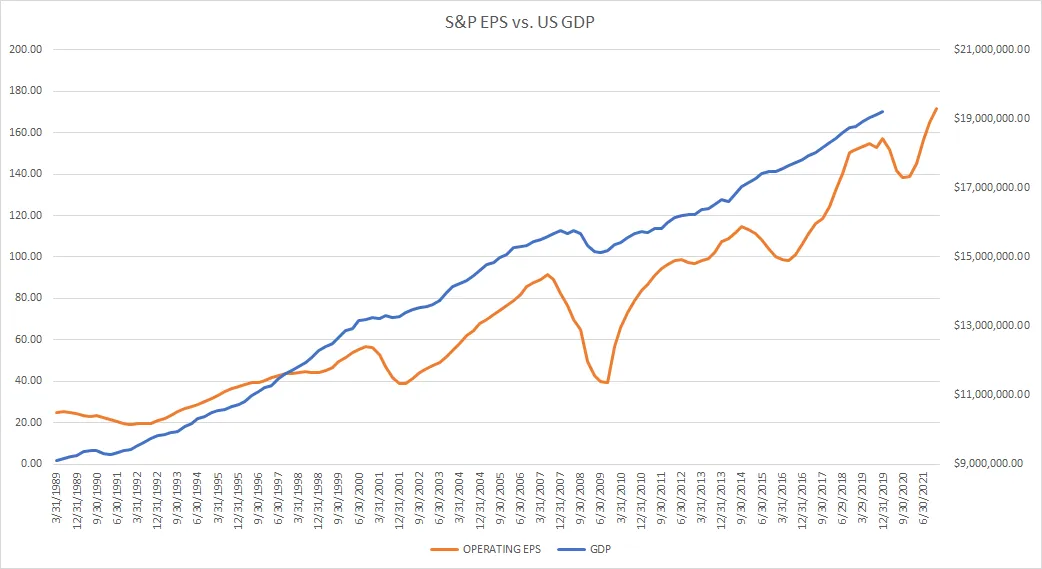
But the problem here is that earnings estimates are trending lower, and are likely not finished falling just yet.
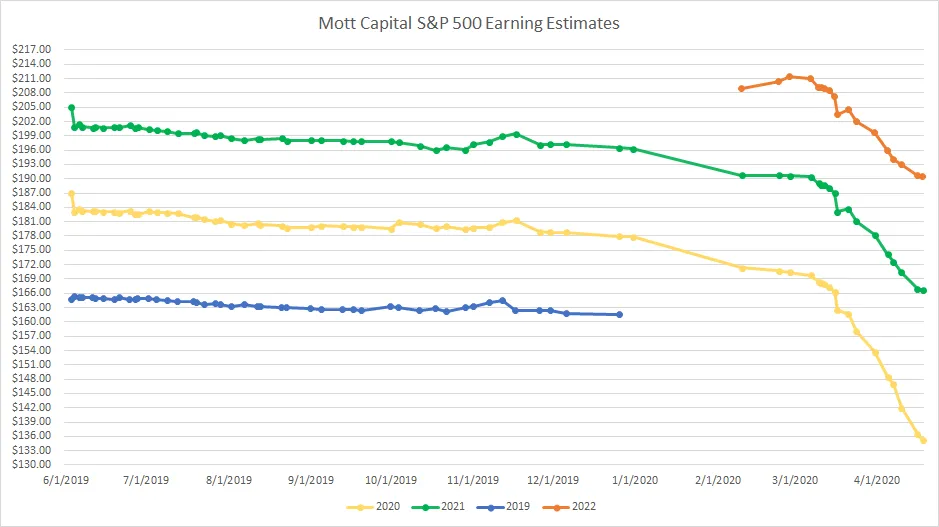
My earnings model tends to run just a little bit ahead of S&P Dow Jones, and perhaps that is because I’m pulling data on a real-time basis, and they are only updating their spreadsheets once per week. You can see below I am forecasting earnings of $135.16 per share in 2020, $166.58 in 2021, and $190.54 in 2022.
I had noted a few backs that I believe earnings could be down by as much 30% in 2020, falling to around $110 per share. That is the general direction we continue to trend towards. My worst-case scenario is currently modeling $117.61 in 2020, bringing us closer to my earnings target. My worst-case scenario for 2021 is at $147.94.
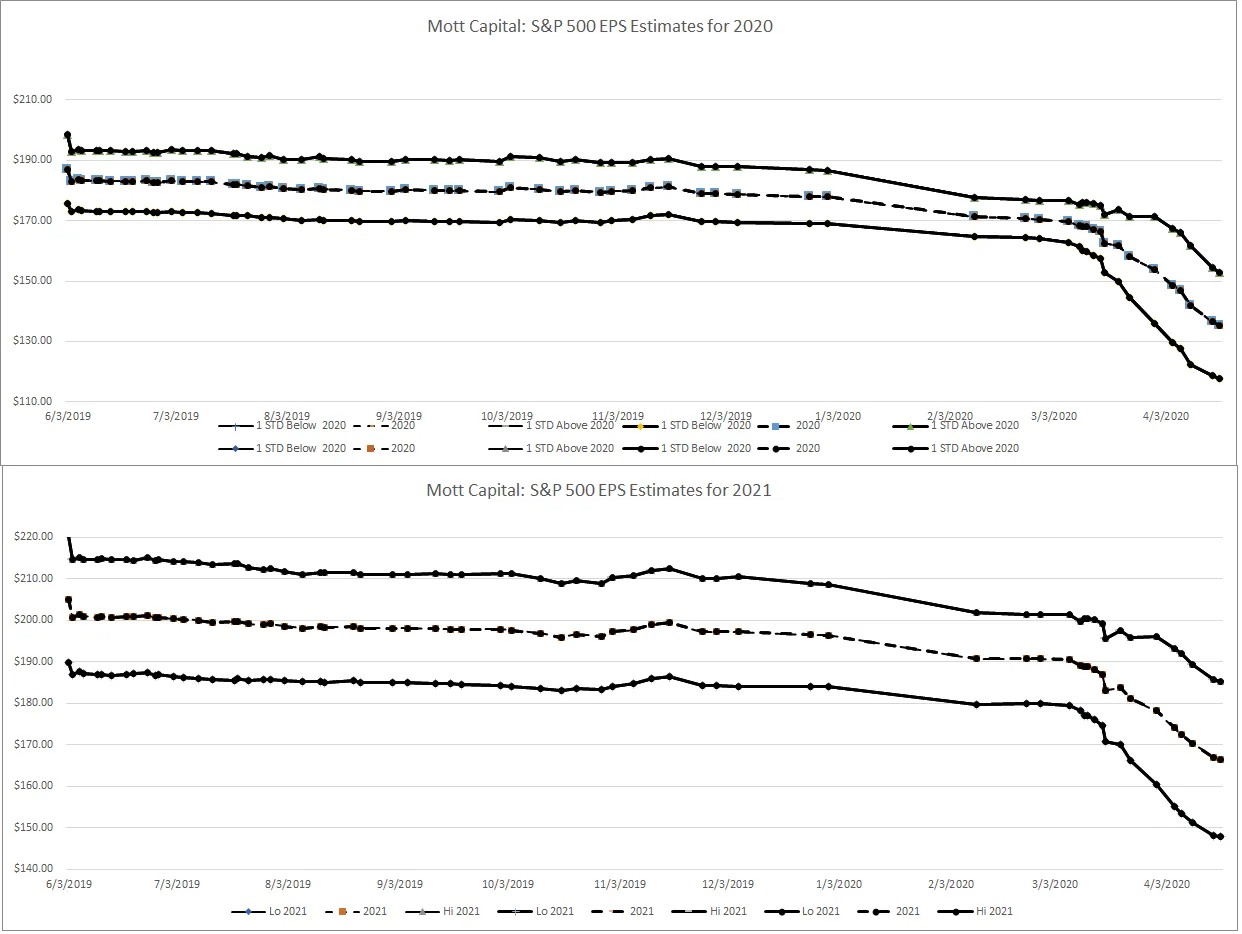
Using my target for $110 in eps for 2020 and $132 for 2021 based on historical recessionary trends and sentiment of the market –the PE ratio, the S&P 500 could be worth between 2,130 and 2,450. It suggests we may get close to retesting the March lows, but not necessarily hitting those March lows.
Short-Term Trends
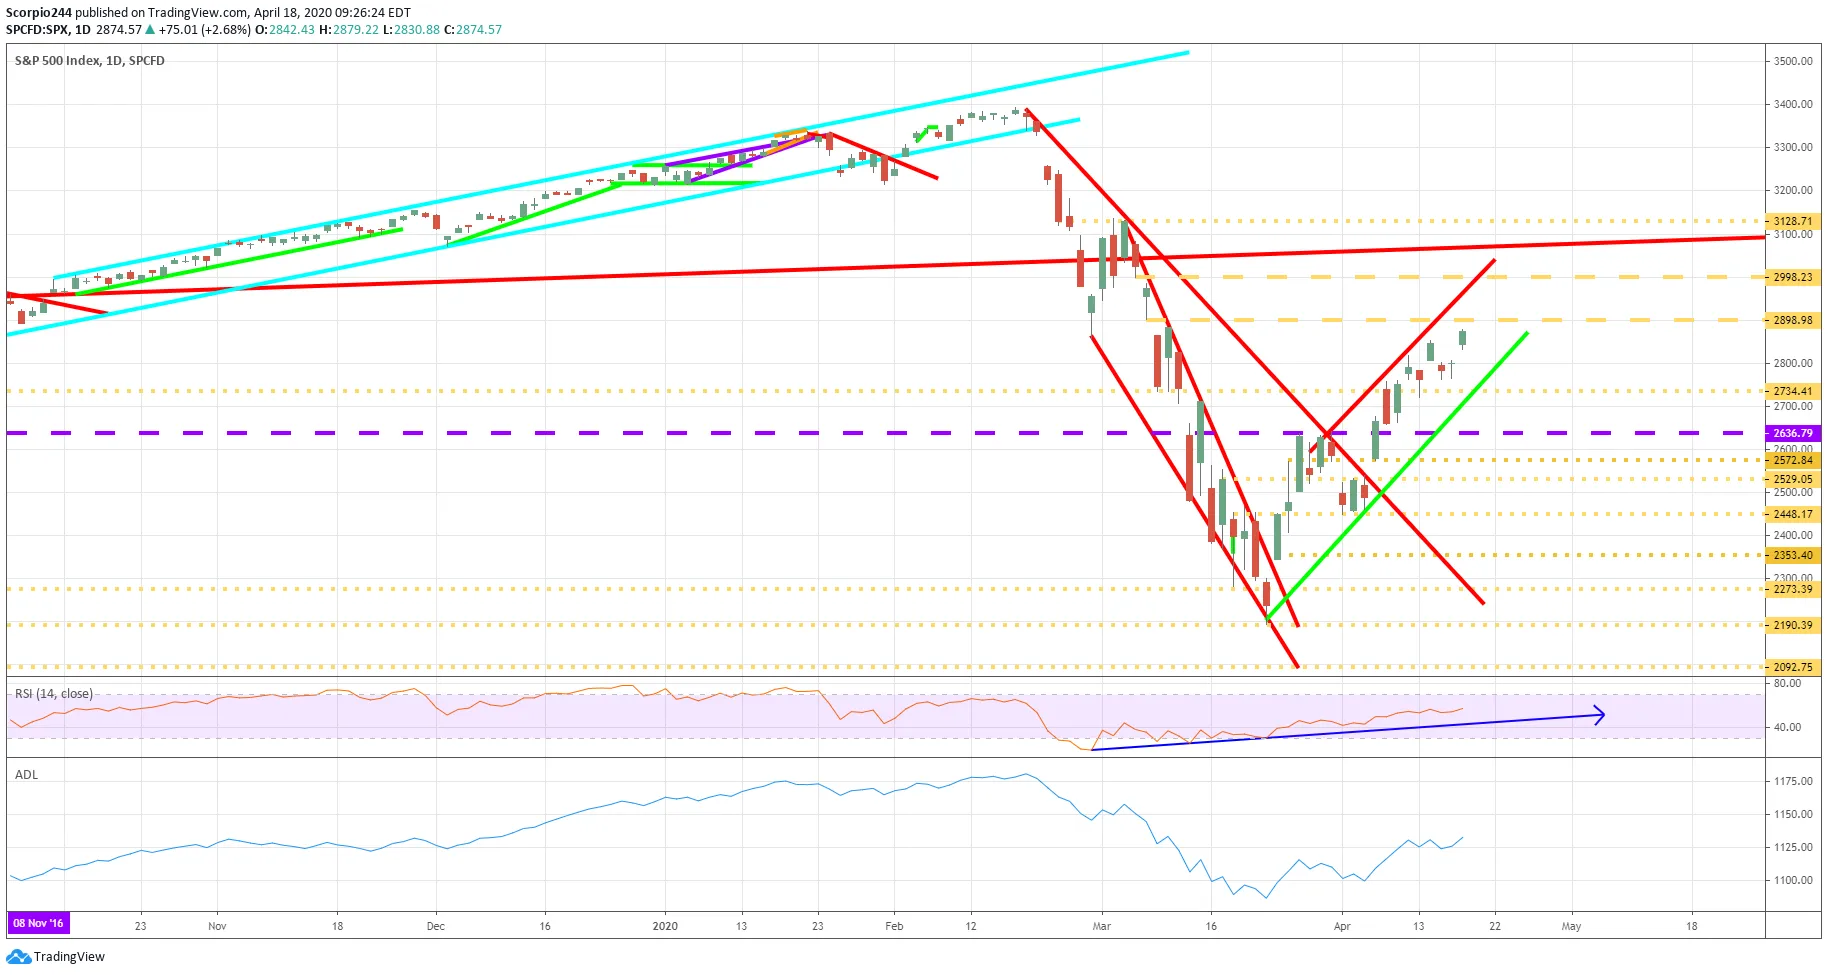
There is still some bullish momentum in the S&P 500, and it suggests the index could continue to rebound and rise to as high as 2,900 or 3,000. But we can also see that the RSI is flattening a bit, as is the advance-decline line. So at this point, the risk, I feel, is more significant to the downside than to the upside.
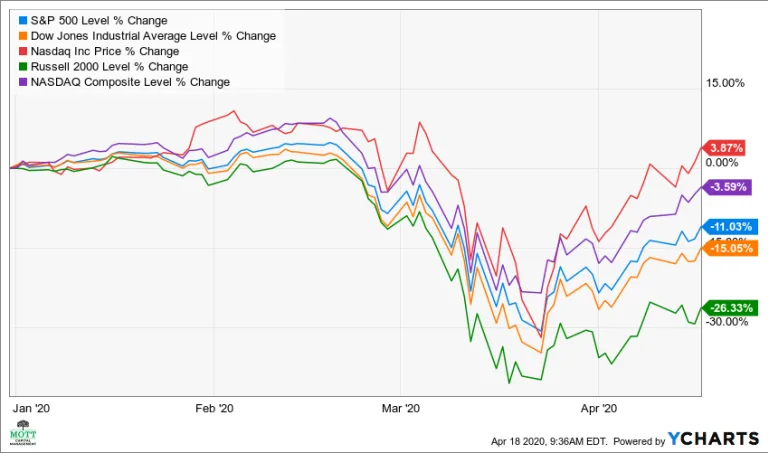
Also, the extent of the recovery in the market has been driven by just a handful of stocks, as in 4. With the Nasdaq 100 up almost 4% on the year and the Russell 2000 down 26.3% on the year.
Microsoft (NASDAQ:MSFT) has a 5.8% weighting in the S&P 500, Apple (NASDAQ:AAPL) a 5.1% weight, Amazon (NASDAQ:AMZN) 4.3%, Alphabet (NASDAQ:GOOGL) 3.2%, and Facebook (NASDAQ:FB) 1.8%. Just these five stocks have over a 20% weighting. In the QQQ, Microsoft has an 11.9% weight, Apple 11.3%. Amazon 10.5% and Alphabet 7.6%, nearly 40%.
MAGA
So why does the market defy all logic for the time being?
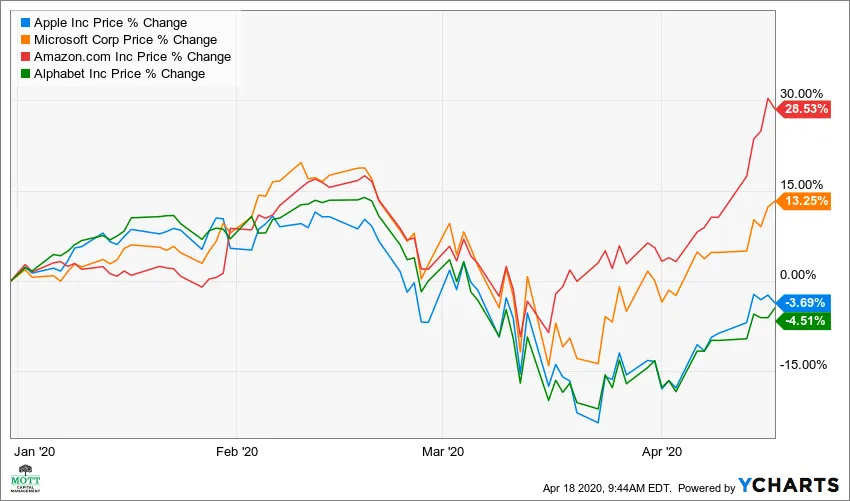
Hey, I own three of the four, so I’m not complaining. I’d own all four, but Amazon’s stock price is always too high, and it throws the smaller accounts I manage out of whack.
But that is why nothing makes sense, for now.
