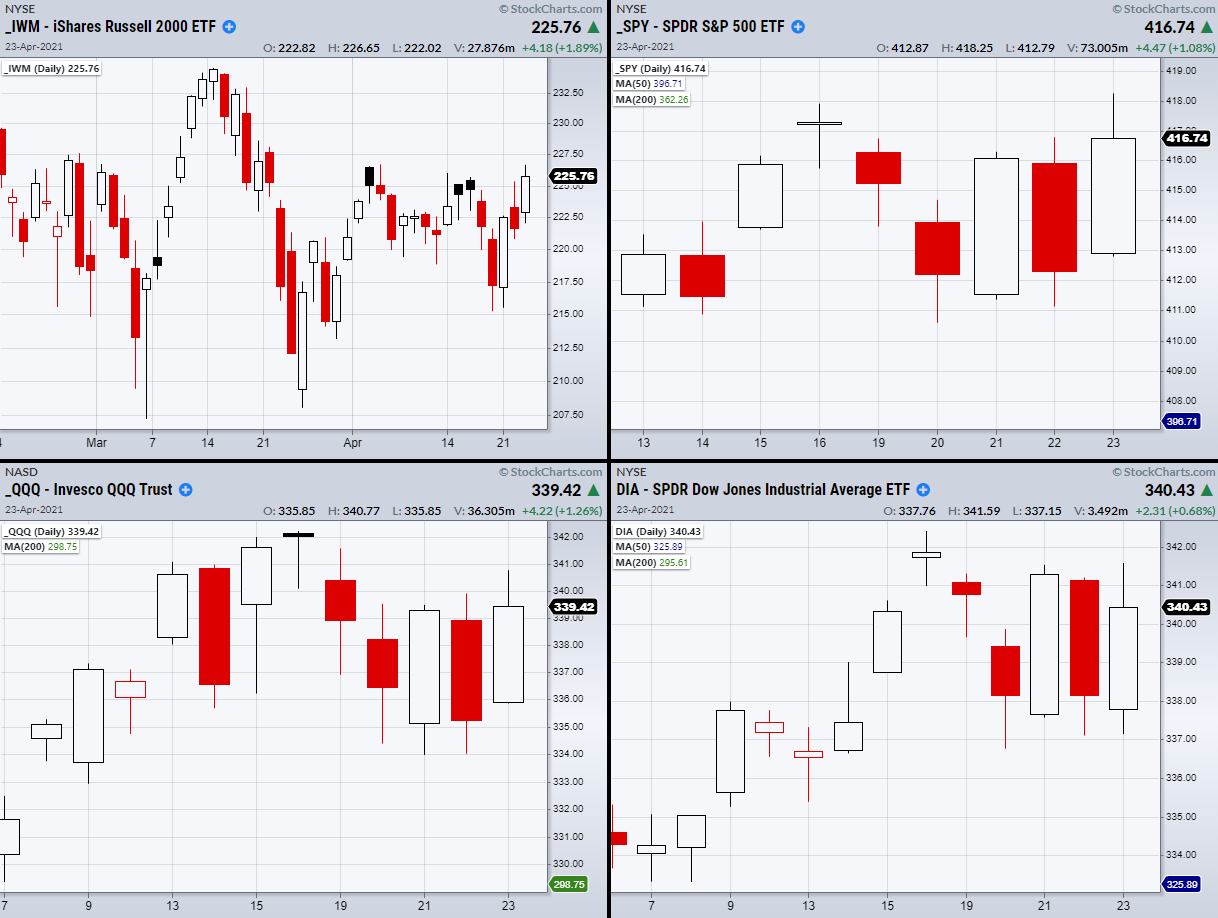
The Russell 2000 iShares Russell 2000 ETF (NYSE:IWM), NASDAQ 100 Invesco QQQ Trust (NASDAQ:QQQ), Dow (DIA) and the S&P 500 SPDR® S&P 500 (NYSE:SPY) all have the potential to make large moves Monday, if they clear their resistance levels together.

This month, the SPY, QQQ, and DIA were able to make substantial gains. Currently they sit close to new high territory. Additionally, each has resistance from a prior high created on Friday, Apr. 16.
However, IWM never made a move back towards all-time highs and has spent most of April struggling to hold over the 50-Day moving average at $222.98. On Friday, IWM came close to clearing its monthly high at $226.69 but missed by 5 cents!
This makes Monday a pivotal day for the small cap sector as clearing the 226.69 price level will mean that IWM is finally looking to get back on track towards its all-time high price at $234.53.
This would also be a great sign for the other indices that could use the boost of IWM’s resistance break to push themselves higher.
It should also be noted that because IWM spent most of its time trading sideways this month, it has the most potential for an explosive move higher when compared to the other indices.
If the situation lines up, we could have a great continuation from Friday’s bullish close.
With that said, we should be carful to set such high expectations as the market plays by its own rules. This means that for Monday, we should look not only for a break of these key resistance points, but also for a large push in momentum through them.
Some of the best breakouts can be confirmed with large amounts of volume to back them up.
ETF Summary
- S&P 500 (SPY) Needs to clear 417.91 and hold.
- Russell 2000 (IWM) Resistance 226.69.
- Dow (DIA) 342.43 resistance.
- NASDAQ (QQQ) 342.23 resistance.
- KRE (Regional Banks) Needs to clear 68.43 April's highs.
- SMH (Semiconductors) Holding over 242.59 the 50-DMA.
- IYT (Transportation) New highs.
- IBB (Biotechnology) Second close over 50-DMA at 154.65 confirms bullish phase.
- XRT (Retail) Cleared recent high of 93.33.
- Volatility Index (VXX) 38.92 recent low.
- Junk Bonds (JNK) 108.56 support.
- XLU (Utilities) Held the 10-DMA at 66.53.
- SLV (Silver) Closed over the 50-DMA at 24.10.
- VBK (Small Cap Growth ETF) 288.11 resistance.
- UGA (US Gas Fund) 31.75 support.
- TLT (iShares 20+ Year Treasuries) Support 139.21.
- USD (Dollar) Broke recent lows.
- MJ (Alternative Harvest ETF) On watch for Monday.
- LIT (Global X Lithium & Battery Tech ETF) Holding over the 50-DMA.
- XOP (Oil and Gas Exploration) 76 resistance.
- DBA (Invesco DB Agriculture Fund Agriculture) 18.75 next main resistance area from 80-month moving average.
