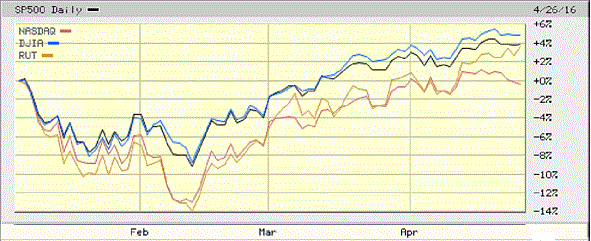
There is much market speculation these days in the mainstream press about whether or not the rally in U.S. stocks can continue, although the rally so far in 2016 is nothing to write home about. The S&P 500 (SPDR S&P 500 (NYSE:SPY)) is up 4%, along with the Russell 2000 (iShares Russell 2000 (NYSE:IWM)).
The Dow Jones is doing a little better, up around 5% (SPDR Dow Jones Industrial Average (NYSE:DIA)), while the NASDAQ is unchanged on the year. It is quite amazing so much attention is given to these investing areas with their puny returns, especially when there have been spectacular profits being made elsewhere in other country’s markets and in certain industry groups during the same time.
Much Ado About Very Little: 2016 Rally in U.S. Stock Indexes

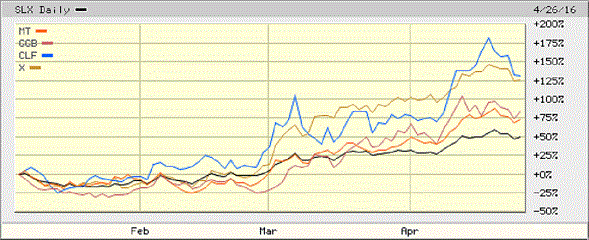
Stocks of companies with steel and iron ore operations are toward the top of the list in providing investors with the best returns in the first four months of this year (gold, silver and other non-ferrous metal mining stocks are usually close competition). Steel stocks (Market Vectors Steel (NYSE:SLX)) overall are up 50% this year.
As good as this is, those with both iron ore and steel operations have done much better. Cliffs Natural Resources (NYSE:CLF), which has iron ore mines and pellet plants, was up over 175% at one point. U.S. Steel (NYSE:X), which is an integrated iron ore and steel operation was up almost 150%. Gerdau S.A. (NYSE:GGB) was up a mere 100% at its peak price and ArcelorMittal (NYSE:MT), also an integrated steel producer like U.S. Steel, was up only a little over 75%.
In the chart below SLX is the black line, X is the bronze line, CLF is the blue line, GBB is the red line, and MT is the orange line.
Steel and Iron Ore Stocks So Far in 2016

The frothy rally in iron ore and steel (covered previously here and here) is puzzling considering the global industrial sector, while doing OK, isn’t doing nearly well enough to justify it (see here). On the U.S. markets, the materials sector (Materials Select Sector SPDR (NYSE:XLB)) is up around 10% and the industrial sector (Industrial Select Sector SPDR (NYSE:XLI)) is up around 8% this year, hardly justifying steel and iron ore stocks with 75% to 175% rallies. As is frequently the case with unusual market activity, the source seems to originate in China.
Goldman Sachs has recently stated its biggest concern about the markets is iron ore speculation in China. Morgan Stanley has also commented on this. A shortage of steel occurred because of a rebound in China’s construction sector combined with a huge increase in government infrastructure spending. Trading volume on the country’s Dalian exchange—where iron ore and steel are traded—is now up 400% year-over-year.
Daily trading volumes have gone so high that they can now exceed annual imports. Trading in iron ore and steel there has been described as a speculative frenzy. Iron ore futures are up 40% and rebar steel is up 48% in 2016. The exchange has increased margin requirements and fees in order to cool down what appears to be an incipient bubble.
There is no question that steel stocks and iron ore are going to go down — eventually. After all, nothing can go up forever and a either a period of consolidation (sideways movement) or a significant drop is inevitable.
Strong rallies can go on much longer than anyone expects them to, however. There were already calls for a top in steel and iron ore prices in early March and that didn’t happen. Investors long on this sector should at least take some profits and watch price movements closely. When governmental authorities want to lower the price of a commodity, they are usually successful.
