Summary: Over the past year, earnings for the S&P have declined 12%. Earnings have declined 5 quarters in a row. Even excluding the troubled energy sector, valuations now are as high (or higher) than in 2007. It's no wonder that there has been little net gain in the S&P since late 2014.
Does the dire state of corporate sales and profit growth signal an imminent recession?
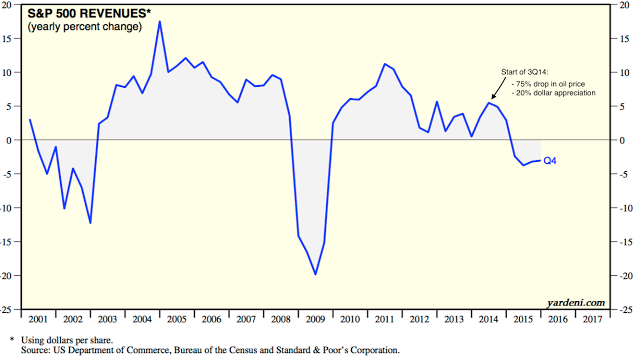
The decline in sales growth that started in 3Q14 corresponds with both the start of a 75% drop in the price of energy as well as the start of a 20% appreciation in the dollar. Currency effects aside, the sales and profits for the majority of sectors are not weak. Moreover, parallels to the 2000 tech bubble and the 2007 financial bubble are largely without merit. On balance, corporate sales and profit growth are most likely not signaling an imminent recession.
About 90% of the S&P has reported earnings for 1Q16. And, very simply, these reports are bleak, showing declining sales and declining profits:
Sales fell 2% yoy on a trailing 12-month basis (TTM), the third quarter in a row that sales have fallen.
Earnings per share (TTM, GAAP-basis) declined by 12% yoy, the fifth quarter in a row that profits have fallen. Unless otherwise stated, all data in this post is from S&P (enlarge any image by clicking on it).
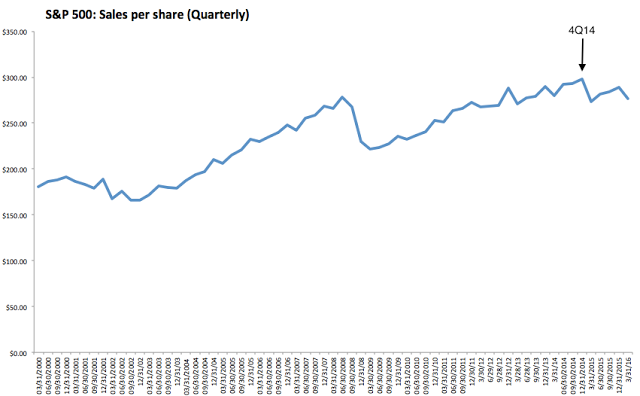
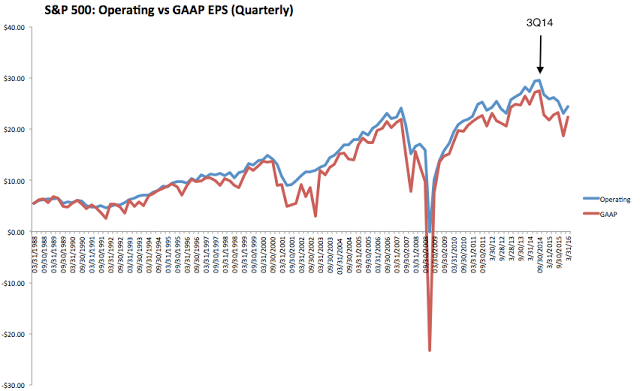
As the charts above show, the pivot point to poor sales and profit growth was the period from September to December 2014. Until that time, both sales and profits had been growing at a healthy rate.
Not coincidentally, the S&P was trading at between 2000-2100 in late 2014, about the same level it's trading at now. There has been almost no net gain in the index since the growth in sales and profits ended.

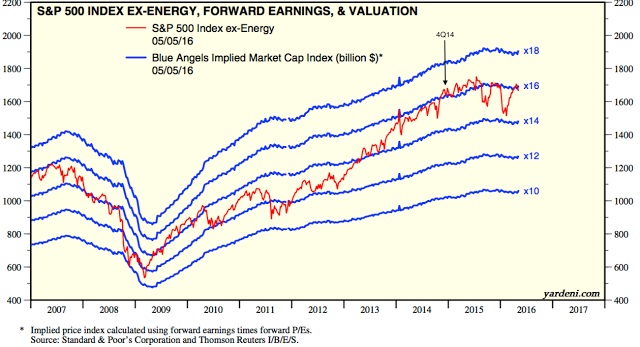
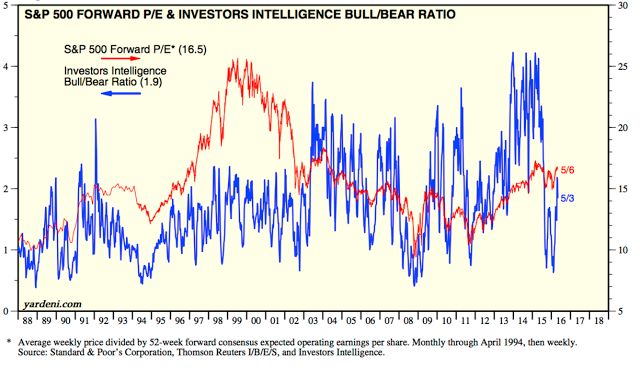
Aside from growth, one of the issues impeding the S&P has been valuation. Even excluding the troubled energy sector, valuations were rich at the end of 2014 and remain so today. These valuations are at the same level as in mid-2007 when the prior bull market ended (from Yardeni).
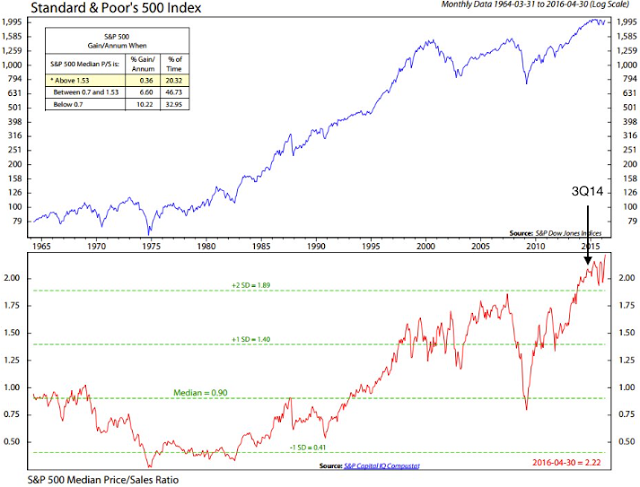
Price to sales ratios are more extreme. The chart below includes energy, but valuations on this basis were historically high even in 3Q14 when oil prices were still near their highs (from NDR).
We wrote about low growth and high valuations in November 2014. Our conclusion was that forward returns were likely to be very small or even negative, more or less as they have been. You can read that post here.
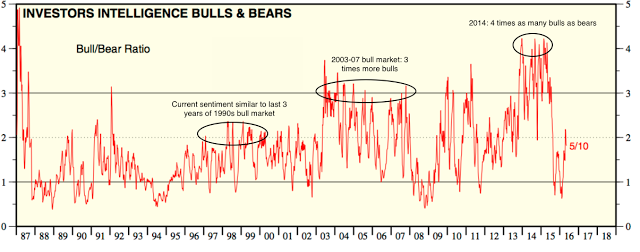
Our top-down view on the equity market has been that bearish investors' best argument for poor equity returns is weak earnings growth and high valuations. That is still our view. In the period since late 2014, sentiment has become much less bullish and the economy has continued to grow, albeit at a slow rate. Neither sentiment nor macro is a particularly robust bearish argument against positive forward returns in US equities (from Yardeni).
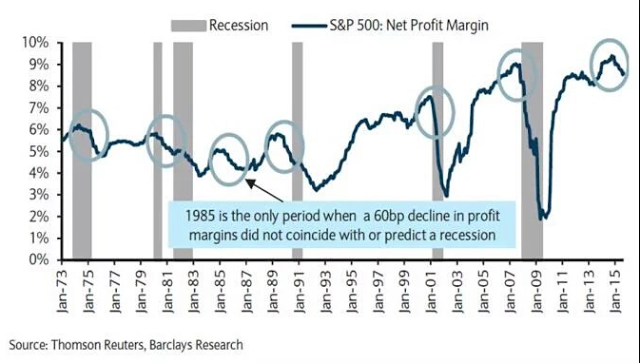
Barclays says that big drops in profitability, like those in the past year, have coincided with a recession 5 of the last 6 times since 1973 (read further here). So, are weak (or negative) sales and earnings indicating an imminent recession now?
The answer is probably no. To understand why, let's look more closely at sales and EPS since their peak in late 2014, starting with sales.
At this point, it is well known that the most problematic sector in the S&P index has been energy, where sales have fallen by more than half since late 2014. This has had a substantial impact on overall sales, as energy was one of the largest sectors in the S&P in mid-2014. Materials sales have also fallen, but the sector is very small.
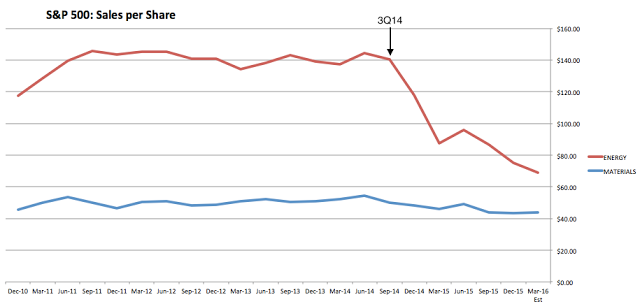
When looking at the sales for all the other sectors in the S&P, the large falls in energy and materials look like outliers. If weak sales were indicating an imminent recession, we'd expect to see falling sales in more sectors than just those two. We aren't.
Total sales for healthcare, industrials and consumer discretionary sectors made new highs in December 2015. Growth for healthcare and discretionary sectors has been the strongest among all the sectors in the S&P.
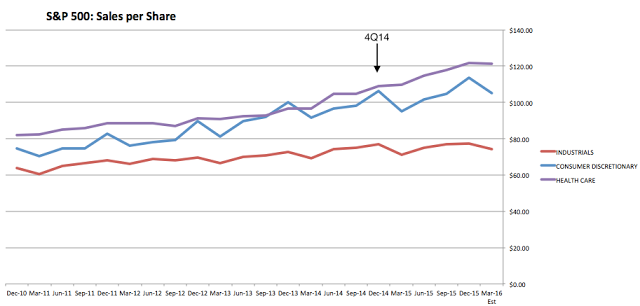
Staples, financials, technology and utilities have seen almost no growth in the past several quarters. There are no disasters here, but no growth either.
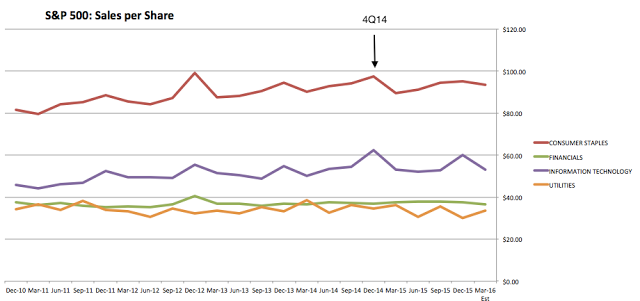
In fact, excluding the energy sector, the combined sales of the other sectors in the S&P are at a new high. Simply stated: corporate sales are not indicating widespread weakness in the economy (from Yardeni).
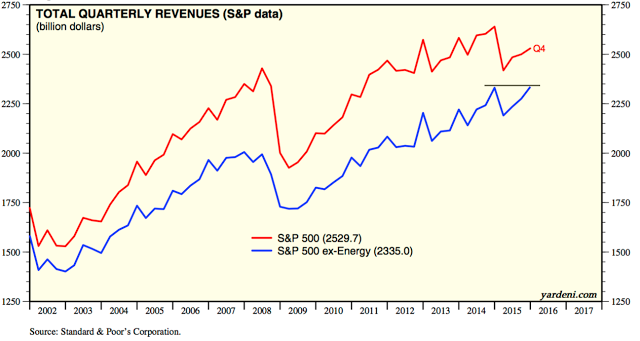
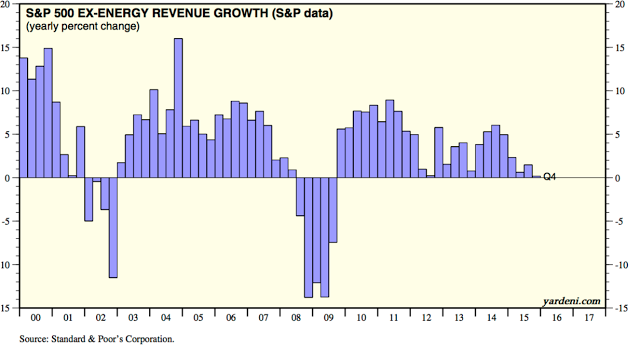
That is not to say that the combined sales outside of the energy sector are strong. While healthcare and discretionary sectors are growing, most sectors simply have no growth (from Yardeni).
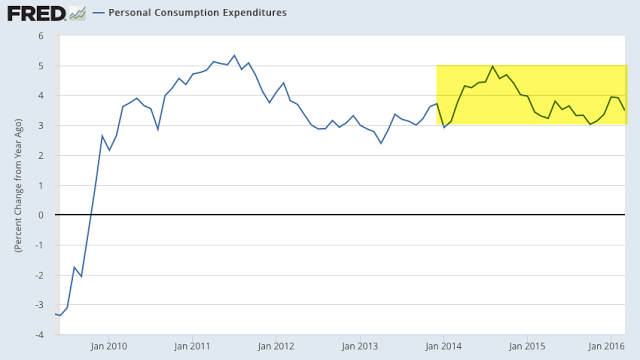
Why is non-energy sales growth so slow? US demand growth, measured a number of different ways, has been about 3-5% nominal YoY during the past two years. There has been no marked deterioration in domestic consumption.
But companies in the S&P derive about half of their sales from outside of the US. Technology and materials are the sectors most dependent on foreign sales, but even 40% of staples sales come from overseas (from Forbes).
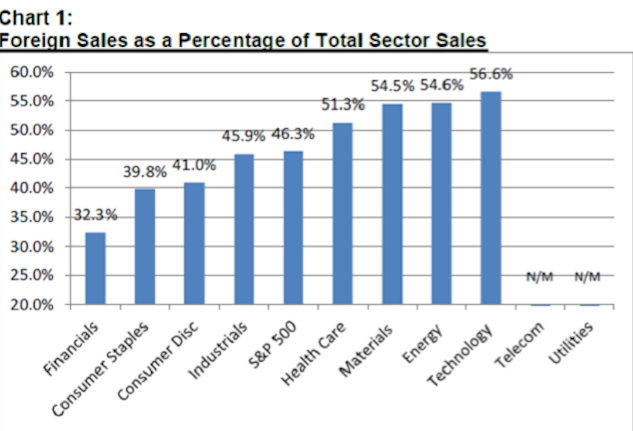
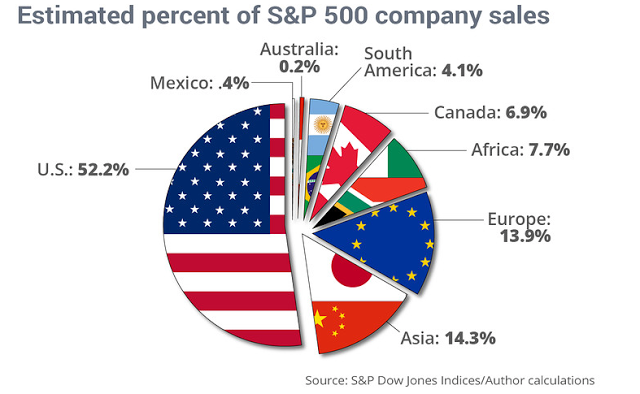
Most of those foreign sales come from Asia and Europe.
Growth in Europe and Japan is less than in the US - at about 1-1.5% (real) - while emerging markets are growing at more than 5%. Like the US, foreign growth may not be high, but it is positive (from the IMF).
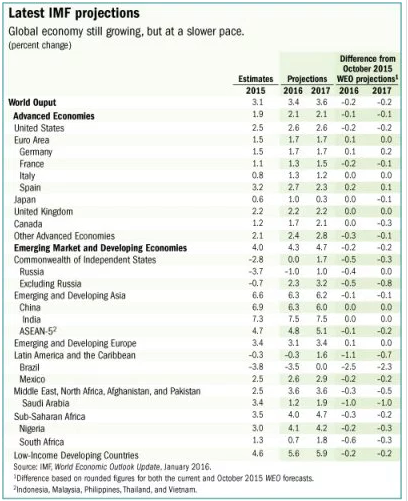
If half of the sales from the US are growing at 3% and the other half are growing at the rates shown above, then overall S&P sales should be growing at least 3% in nominal terms. Why has recent growth been closer to zero?
The likely culprit is the dollar. When the dollar rises in value, the value of sales earned abroad (in foreign currency) falls. If foreign sales grow 5% but the dollar gains 5% against other currencies, then sales growth will be zero in dollar terms.
In fact, that has been a well-established pattern for more than 30 years. Over time, the importance of the dollar's value has grown as the proportion of S&P sales outside of the US has risen (from Yardeni).
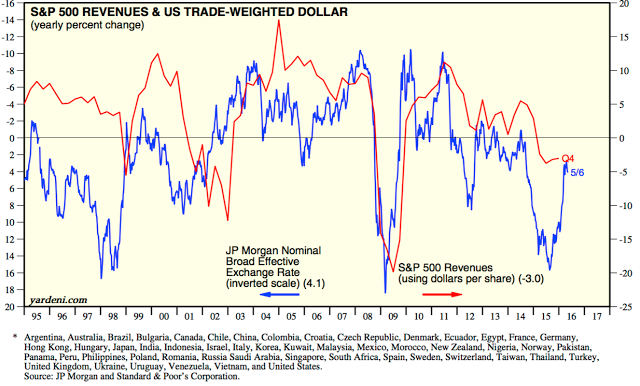
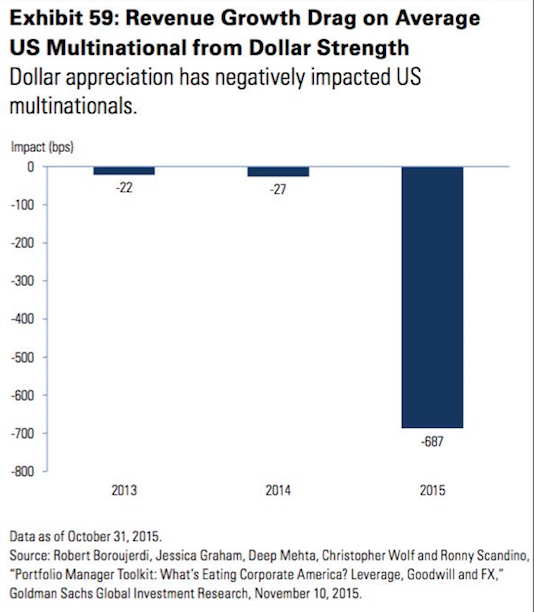
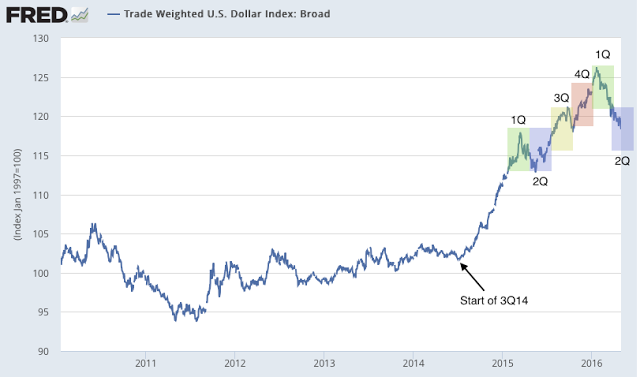
The trade-weighted dollar began to rapidly appreciate in July 2014 (3Q14) just as sales on the S&P peaked. Over the next 18 months, until the end of 4Q15, the dollar appreciated 20%. With half of the sales of the S&P coming from outside the US, the dollar's appreciation alone cut S&P sales by 10 percentage points. A similar fall in sales growth occurred in 1998 when the dollar appreciated by more than 10% over the course of a year (shown in the chart above).
For calendar 2015, Goldman estimates that the dollar's appreciation reduced sales growth by 7 percentage points.
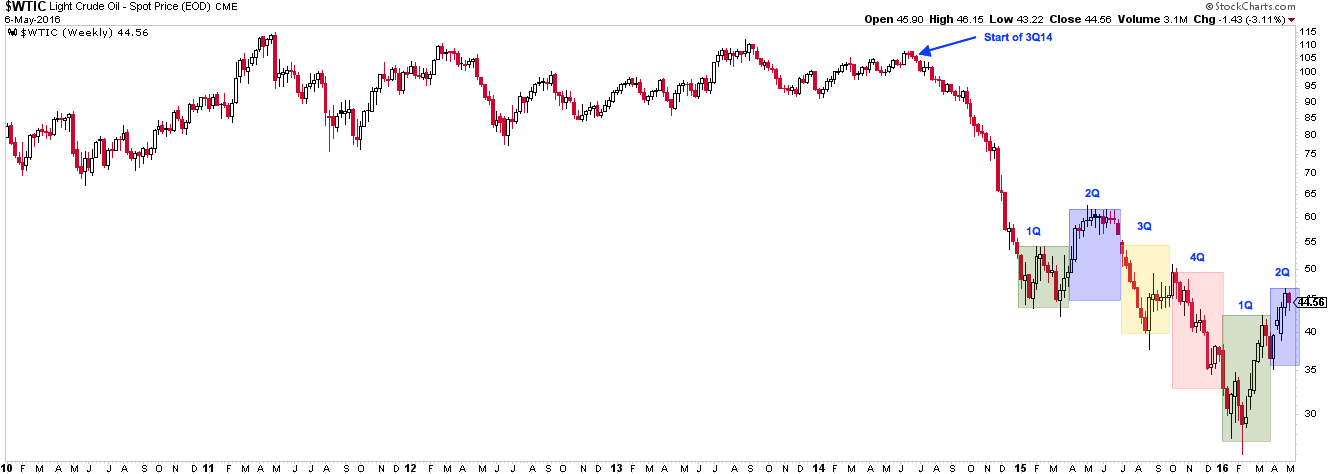
In summary, the decline in sales growth that started in 3Q14 corresponds with both the start of a 75% drop in the price of energy as well as the start of a 20% appreciation in the dollar. The full brunt of these two extreme changes was felt during the course of 2015.
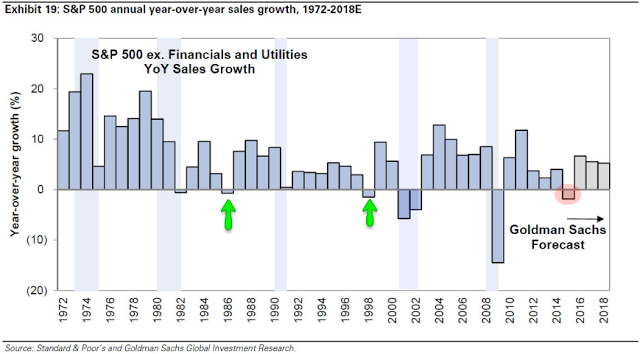
Which brings us back to the consternation within the investment community about the drop in corporate sales (and profits) indicating an imminent recession. Of course, falling sales is often the case during a recession. But, importantly, this is not always the case (arrows). Like 1986 and 1997-98, the current fall in S&P sales is taking place due to extreme changes in oil prices and the dollar. In neither of those instances did the economy slide into a recession (from Goldman).
Let's now look at earnings.
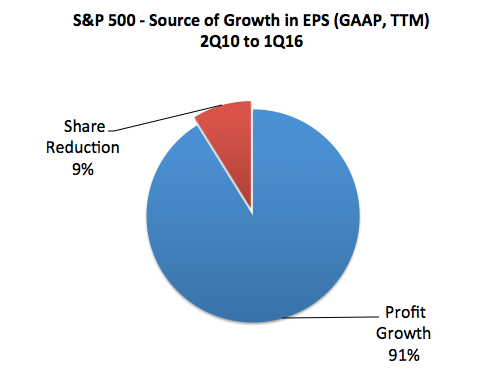
First, let's remove two misconceptions. One is that corporate buybacks have been the main source of profit growth. This is false; more than 90% of the growth in earnings in the S&P since 2010 has come from better profits, not share reductions. This is a topic we have specifically addressed before (most recently here).
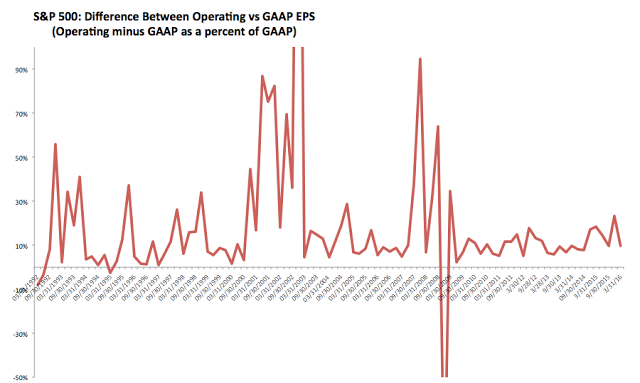
The second misconception is that "operating earnings" have abnormally deviated from earnings based on GAAP in recent quarters. It is true that earnings are both overstated and smoothed on an operating basis, but that has been the case over several decades. This is not new.
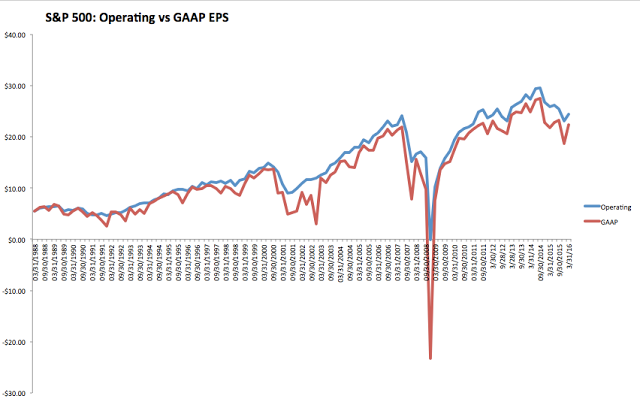
The difference between operating and GAAP earnings is now about 10%, which is the median over the past 25 years. Operating earnings overstated profits by much more in the 1990s bull market and earlier in the current bull market. The biggest differences have always been during bear markets.
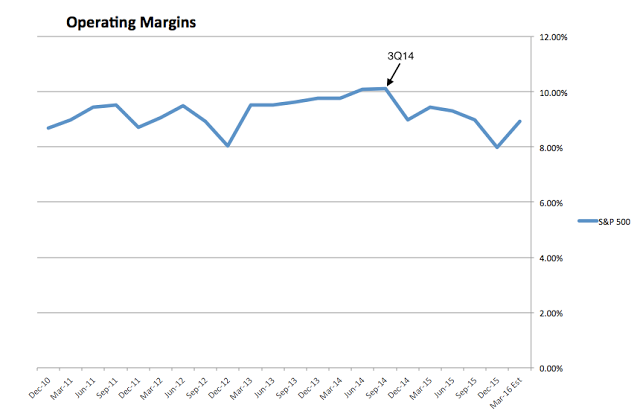
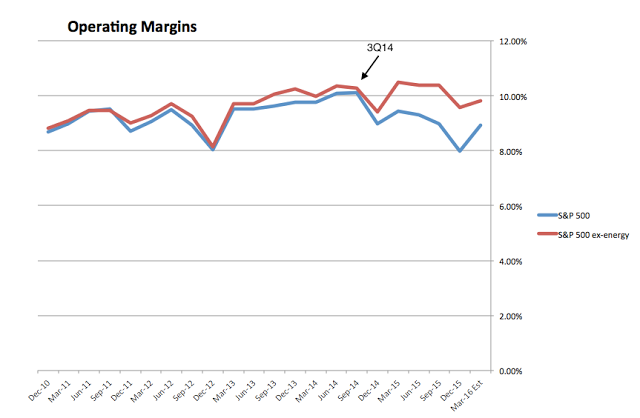
Given the forgoing discussion on sales growth, it should come as no surprise that corporate profit margins peaked in 3Q14, before the rapid fall in energy prices and appreciation in the dollar. In 3Q14, margins were 10.1%; that fell to a low of 8% in 4Q15 before rebounding in 1Q16 to 8.9%.
For most sectors, margins have been nearly flat between 3Q14 and 1Q16. In the interim, the margins of industrials, financials, technology, staples and discretionary have made new highs (circles). Of the sectors shown below, only the margins of healthcare have not made a new high since 3Q14.
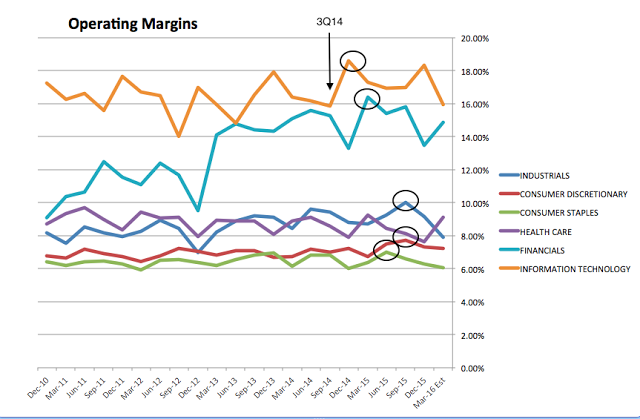
With flat sales growth and flat margins, it's no surprise that many sectors have not seen any profit growth in the past 18 months.
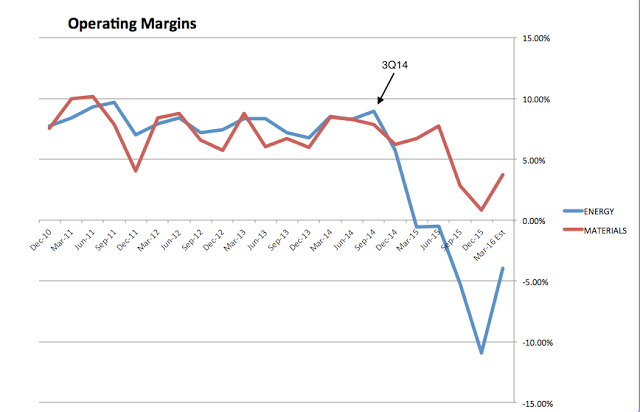
Recall that sales growth for energy companies has fallen by more than half. Even with flat margins, energy profits would have also halved. But energy profit margins fell from 9% in 3Q14 to negative 11% in 4Q15. Materials margins fell from 8% to 1% during that period. These two sectors are the source for nearly all of the decline in the total S&P's margins since 3Q14.
Without the negative drag from energy, total margins for the S&P are not substantially different now (9.6%) than they were in 3Q14 (10.2%). In the interim, total margins made a new high in 1Q15 (10.5%) and were again nearly at a new high in 3Q15 (10.4%).
There are several knocks on the practice of excluding energy from the other sectors. Most of these miss a basic truth: that in the past, large drops in energy sales and profits have falsely signaled economic risks that did not then materialize. This is the proverbial movie we have seen before.
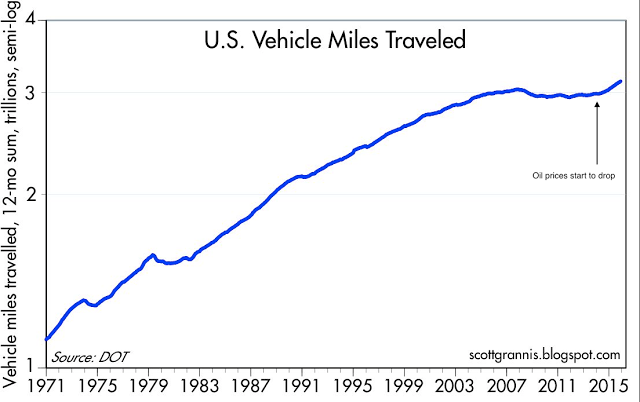
Lower gas prices do not materially impact other consumer spending. Gas represents only 5% of a typical family's consumer spending. This is quite small. Between early 2014 and early 2015, during which oil prices fell by about 60%, the median family saved only 20% on their gas bill. The difference was spent on more gas or higher grades of gas. That 20% saving also amounted to just $22 per month. Most of that was then spent on other consumer items, mostly food and other non-durables. But the overall boost to consumption was less than 1% (read more here; chart from Grannis).
Lower energy and material prices would not have a notable positive impact on margins for most of the other large sectors like healthcare (pharmaceuticals), technology (Apple (NASDAQ:AAPL) and Microsoft (NASDAQ:MSFT)), staples (junk food and tobacco) and discretionary (retail, entertainment and restaurants). The importance of energy as an input cost is too minor.
The one exception to this might be industrials, which includes transportation stocks. Even so, gains for some companies (like United Parcel Service (NYSE:UPS)) would be countered by falls for others (like rails that transport energy and companies like Caterpillar (NYSE:CAT) whose equipment extracts energy and materials). Moreover, this sector accounts for just 12% of the S&P, so the overall impact from energy savings is still not significant.
Another knock on excluding energy is that "it is like excluding technology in 2000 or financials in 2007". This is wrong for several reasons.
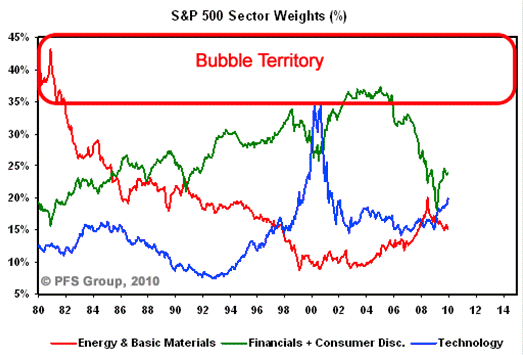
Technology and financial stocks were in a bubble in 2000 and 2007, respectively. Their market capitalization weighting in the S&P reached an extreme ahead of both of the subsequent bear markets: a 35% weighting for technology and 25% weighting for financials. Extreme over-valuation had also been the case with energy stocks in 1980-81. In comparison, at their recent peak in 2013-14, energy accounted for just 13% of the S&P. This was in line with several other sectors and nowhere near an extreme (from PFS).
Similarly, the profits produced by energy were not excessive in 2013-14 the way that financial company profits dominated the S&P in 2006-07. Financials became, by far, the largest source of profits for the S&P into the bubble. In comparison, energy profits were similar to at least 4-5 other sectors in 2013-14.
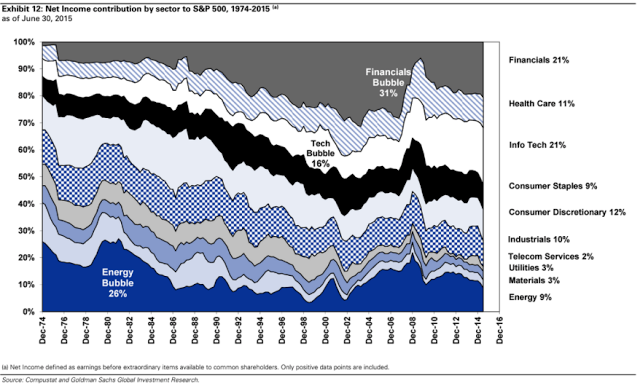
You can see in the chart above that technology profits were never excessive into the 2000 bubble. The 2000 peak in the S&P had nothing to do with the excessive sales and profits of technology companies because they produced very little of either. Extreme market valuations and investor euphoria are what made that a bubble.
Finally, the current environment in nothing like 2006-07 because financial excesses in the banking sector are completely unlike excesses in energy or any other sector. Banks that are excessively leveraged are at risk of failure, so when they retrench in order to stabilize, lending to the rest of the economy is reduced, creating a drop in investment and consumption and a recession. Banks are a source of systemic risk; other sectors are not.
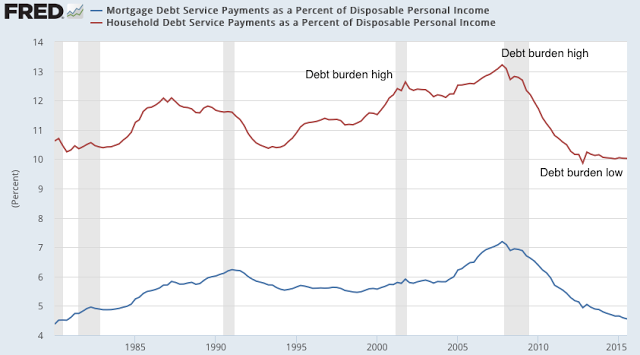
Moreover, the concurrent excesses in household debt reduce future consumption during the subsequent period of deleveraging. In comparison to both 2000 and 2007, household debt levels are now at a 35 year low.
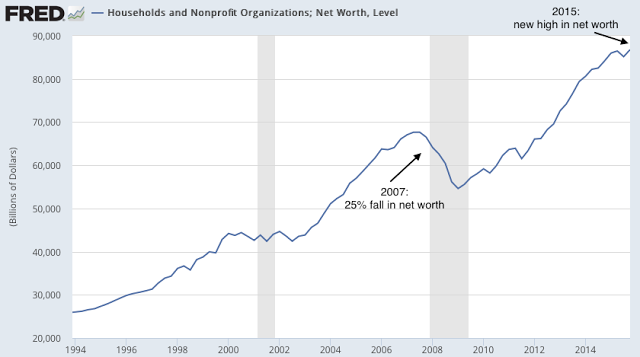
Problems in the banking system subsequently reduced household net worth in 2007-08 by 25%, equal to a full year of GDP. In comparison, household net worth reached a new high at the end of 2015.
For all these reasons, the fall in the financial sector in 2007 is nothing like the current situation with energy.
So what happens next with sales and profits for the S&P? There are many variables, but the price of oil and the value of the dollar are probably still the most significant.
The fall in energy prices since mid-2014 was among the largest in more than 35 years. Some of these prior falls corresponded with recessions (1990, 2000 and 2008) while others did not (1986, 1997 and now). Most significantly, all of these led to higher oil prices over the next several years.
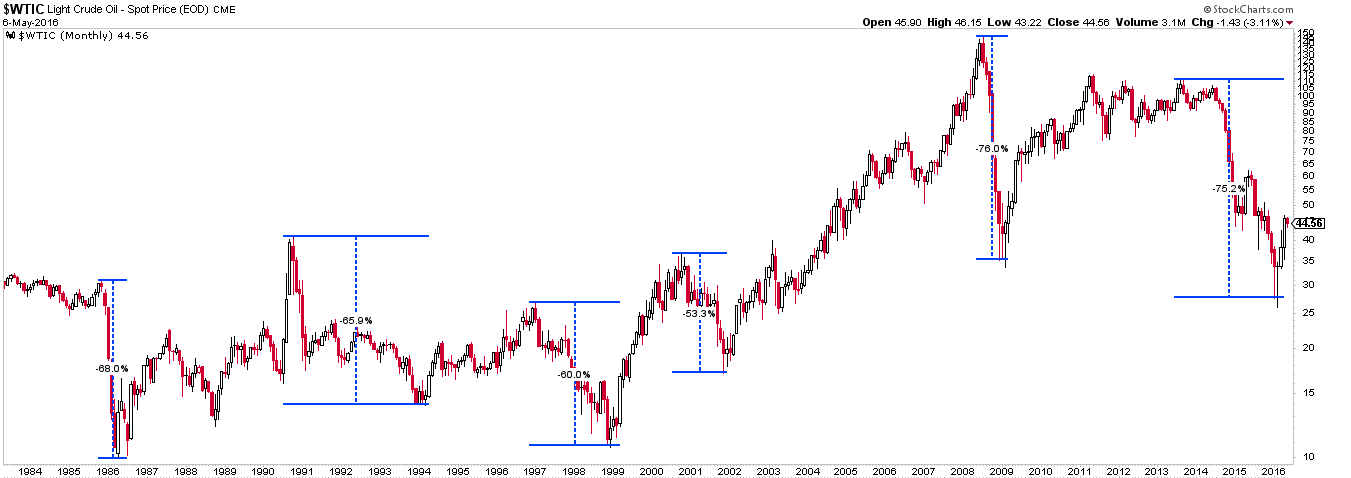
We don't know what energy prices will do the rest of the year, but the YoY negative impact of energy prices on S&P sales will probably be muted from 2Q16 on: the average price of oil a year ago was a little over $50 versus $45 today. Oil prices would have to average about $20 in 2016 to equal the impact from 2015. This seems unlikely: in the chart above, note that prior drops on the order of the one in 2015 marked a low from which prices moved higher.
Similarly, we don't know what the dollar will do for the remainder of 2016 either, but we can say that at the current exchange rate, the dollar's negative impact on sales growth will be very minor and any further decline in the dollar would become a tailwind for sales growth.
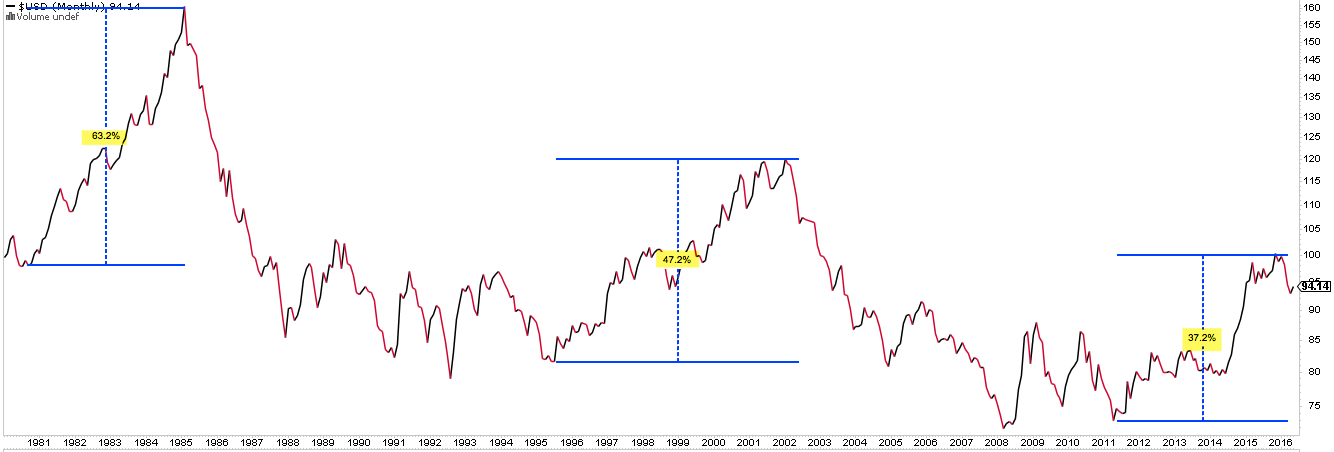
That said, a flat or lower dollar is not a certainty. In both the early 1980s and the late 1990s, the dollar's appreciation continued.
The most likely scenario for forward sales and profits is probably something like this: if oil prices remain near the current $45 then the energy sector will no longer be a drag on the rest of the S&P. Assuming a stable dollar as well, then the S&P's sales and earnings will revert back to growth of 3-5%, matching the nominal economic growth in the US and elsewhere.
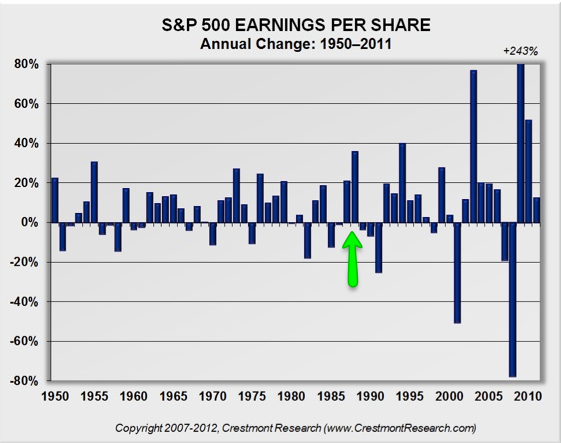
An optimistic scenario would require a continued rebound in oil prices and decline in the value of the dollar. That's not impossible: this combination is, in part, what propelled the 20% growth that started in 1986 and continued through 1988 (arrow).
Finally, the most pessimistic scenario would be if energy prices once again fall and/or the dollar resumes its rapid appreciation. In this case, corporate sales and earnings will continue to drop, although it will be hard to match the negative impact of a 75% fall in oil price and a 20% gain in the dollar.
If predicting future values for oil and the dollar aren't challenging enough, then consider the importance of investor sentiment. When investors become bullish, valuations rise. And vice versa, when investors become pessimistic, valuations sink. If oil prices and the dollar stabilize, earnings growth may be only 3-5% yoy but valuations may push the equity market much higher (from Yardeni).
Over the past year, earnings for the S&P have declined 12%. Earnings have declined 5 quarters in a row. Even excluding the troubled energy sector, valuations now are as high (or higher) than in 2007. It's no wonder that there has been little net gain in the S&P since late 2014.
The decline in sales growth that started in 3Q14 corresponds with both the start of a 75% drop in the price of energy as well as the start of a 20% appreciation in the dollar. Currency effects aside, the sales and profits for the majority of sectors are not weak. Moreover, parallels to the 2000 tech bubble and the 2007 financial bubble are without much merit. On balance, corporate sales and profit growth are most likely not signaling an imminent recession.
