Investing.com’s stocks of the week
Background:
Traders often refer the impact of ‘month end flows’ on different currency pairs during the last few days of the month. In essence, these money ‘flows’ are caused by global fund managers and investors rebalancing their currency exposure based on market movements over the last month. For example, if the value of one country’s equity and bond markets increases, these fund managers typically look to sell or hedge their now-elevated exposure to that country’s currency and rebalance their risk back to an underperforming country’s currency. More severe monthly changes in a country’s asset valuations lead to larger portfolio adjustments between different currencies.
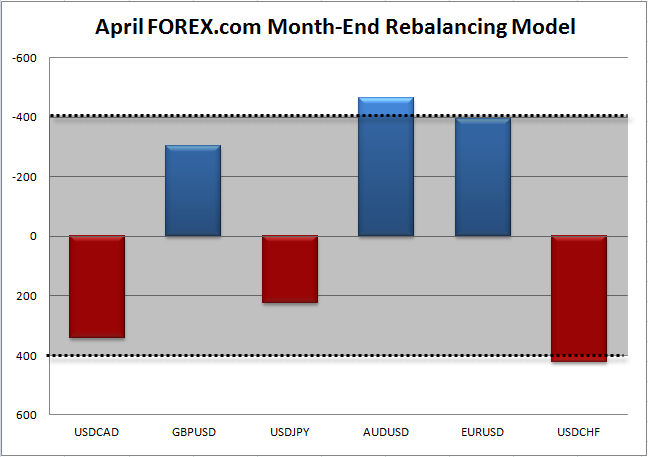
In order to predict these flows and how they impact FX traders, we’ve developed a model that compares monthly changes in the total value of asset markets in various countries. In our model, a relative shift of $400B between countries over the course of a month is seen as the threshold for a meaningful move, whereas monthly changes of less than $400B are often overwhelmed by other fundamental or technical factors. As a final note, the largest impact from month-end flows is typically seen heading into the 11am ET fix (often in the hour from 10 and 11am ET) as portfolio managers scramble to hedge their overall portfolio ahead of the European market close.
As we enter the final week of April, it’s difficult to draw any strong conclusions about global market performance as a whole. Global equity indices were a mixed bag, with some markets edging higher (US indices, the FTSE, the CAC, the Nikkei and a few Asian bourses in particular), some unchanged (DAX and IBEX) and a few even edging lower (India’s Sensex). Bond yields were similarly nuanced, with the US and 10-Year yields essentially unchanged at 1.93% and 0.17%, respectively, while periphery European yields edged up on concerns about Greece and Japanese yields fell.
It’s at times like these where having a rigorous, objective process can help traders prepare for the impact of any month-end flows on the currency market. Our model shows that, on the whole, US capital markets generally outperformed their global counterparts, meaning that global portfolio managers will have to sell US investments and buy other assets to rebalance back to their target allocations. As a result, we could see some dollar selling heading into the middle of the week, though two factors suggest this month’s signal could be less impactful than usual. First, it’s important to note that of the six currency pairs we follow, only two (AUD/USD and USD/CHF) reach the +/- $400B signal that we consider significant. Beyond that, this month’s flows may be overwhelmed by the reaction to Wednesday and Thursday’s high-impact data onslaught (headlined by eurozone CPI, US GDP, and central bank meetings from the Fed, RBNZ, and BOJ).

Source: Forex.com
