
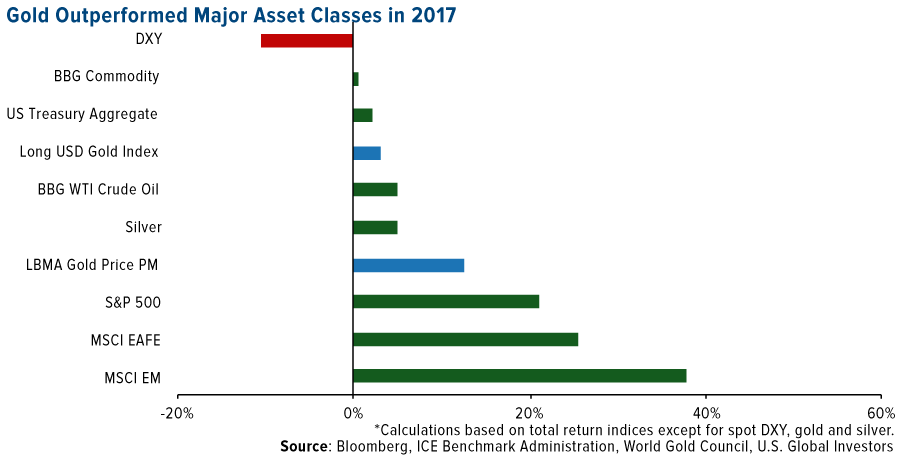
In a year when the S&P 500 hit all-time highs, gold also held strong, finishing 2017 up 13.5 percent, according to the World Gold Council. Gold’s annual gain was the largest since 2010, outperforming all major asset classes other than stocks. Contributing to this gain was a weaker U.S. dollar, stock indices hitting new highs and geopolitical instability, all of which fueled uncertainty. Investors continued to add gold to their portfolios to manage risk exposure, with gold-backed ETFs seeing $8.2 billion of inflows last year.
The World Gold Council (WGC) recently released its annual outlook on the yellow metal identifying four key market trends it believes will support positive gold performance in 2018, and we agree. Below I summarize the report for you and add some of my own thoughts on gold’s trajectory.
Key Trends Influencing Gold in 2018
1. A year of synchronized global economic growth
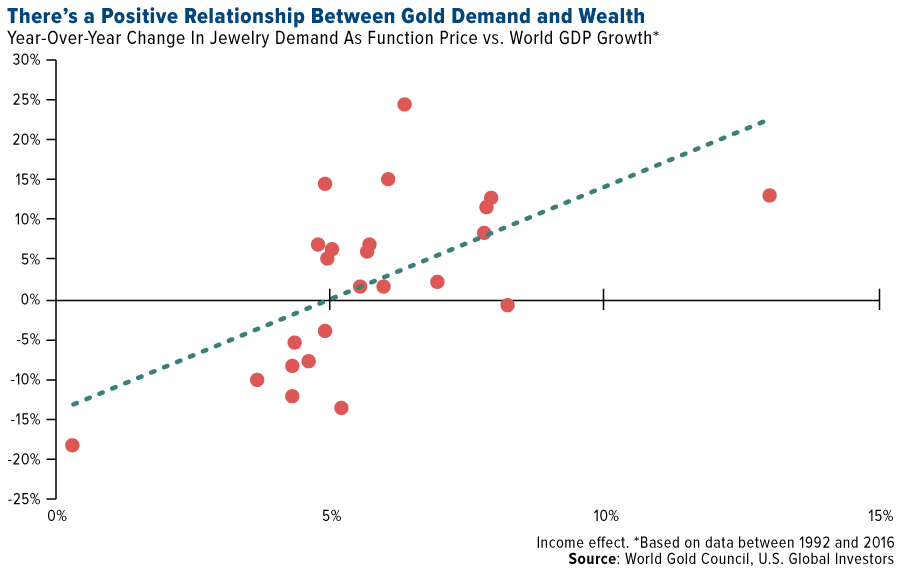
Economies are on the rise with global growth increasing in 2017 and on track to continue the trend this year. China and India, two of the world’s largest consumers of gold, will see their economies and incomes grow due to the implementation of new economic policies. WGC research shows that as incomes rise, the demand for gold jewelry and gold-containing technology tends to rise as well. Investment and consumer demand for the yellow metal results in a lower correlation to other mainstream financial assets, such as stocks, making it an effective portfolio diversifier.
2. Shrinking balance sheets and rising interest rates
Expectations are for the Federal Reserve to raise interest rates three times this year and shrink its balance sheet by allowing $50 billion in Treasuries and mortgage-backed securities to mature each month. Over the past decade, central banks pumped trillions into the global economy and cut interest rates, allowing asset values to break records and market volatility to reach record lows.
With these banks reining in expansionary policies in 2018 and hiking rates as global debt increases, market volatility may go up again, making gold a more attractive asset. According to WGC research, when real rates are between zero and 4 percent, gold’s returns are positive and its volatility and correlation with other mainstream financial assets are below long-run averages.
3. Frothy asset prices
As the WGC points out, not only did asset prices hit multi-year highs around the world in 2017, but the S&P is still sitting at an all-time high. This rosy environment saw investors seeking out additional risks, hoping for additional returns. A continued search for yield has “fueled rampant asset price growth elsewhere,” the report explains. This includes exposure to lower quality companies in the credit markets as well as investments in China.
Although the bull market could very well continue throughout 2018, some analysts and investors alike are understandably cautious about just how much risk exposure to continue taking on. That’s where gold comes in. As you can see in the chart below, the price of the yellow metal tends to increase during periods of systemic risk. Should global financial markets correct, investors could benefit from having an exposure to gold in their portfolio. Historically, gold has reduced losses during periods of distress or instability in the markets.

4. Greater market transparency, efficiency, and access
Financial markets have become more transparent and efficient over the past decade, with new products broadening access for all kinds of investors. Last year the London Bullion Market Association launched a trade-data reporting initiative and the London Metal Exchange launched a suite of exchange-traded contracts intending to improve price transparency, according to the WGC.
In fact, momentum is building in India to develop a national spot exchange to make the market less complicated and fragmented. In addition, more progress in gold investing might be seen in Russia this year with the current 18 percent VAT on gold bars possibly being lifted. More easily accessible gold-backed investment vehicles should lead to more gold investors and transactions worldwide.
Now Could Be a Good Time to Add Gold to Your Portfolio
World Gold Council’s Chief Market Strategist, John Reade, said in his 2018 outlook for gold that, “Over the long run, income growth has been the most important driver of gold demand. And we believe the outlook here is encouraging.”
We couldn’t agree more. Gold has historically helped to improve portfolio risk-adjusted returns. It is a mainstream asset as liquid as other financial securities and its correlation to major asset classes has been low in both expansionary and recessionary periods, as the WGC points out.
All opinions expressed and data provided are subject to change without notice. Some of these opinions may not be appropriate to every investor. By clicking the link(s) above, you will be directed to a third-party website(s). U.S. Global Investors does not endorse all information supplied by this/these website(s) and is not responsible for its/their content.
The Standard & Poor's 500 Index, often abbreviated as the S&P 500, or just the S&P, is an American stock market index based on the market capitalizations of 500large companies having common stock listed on the NYSE or NASDAQ. The S&P 500 index components and their weightings are determined by S&P Dow Jones Indices.
The Bloomberg Dollar Spot Index (BBDXY) tracks the performance of a basket of 10 leading global currencies versus the U.S. Dollar.
The Bloomberg Commodity Index (BCOM) is a broadly diversified commodity price index distributed by Bloomberg Indexes. The index was originally launched in 1998 as the Dow Jones-AIG Commodity Index (DJ-AIGCI) and renamed to Dow Jones-UBS Commodity Index (DJ-UBSCI) in 2009, when UBS acquired the index from AIG.
The Bloomberg Barclays (LON:BARC) US Treasury Index measures US dollar-denominated, fixed-rate, nominal debt issued by the US Treasury.
The Bloomberg WTI Crude Oil Subindex is a single commodity subindex of the Bloomberg CI composed of futures contracts on crude oil. It reflects the return of underlying commodity futures price movements only and is quoted in USD.
The MSCI EAFE (Europe, Australia and Far East) Index measures the performance of the leading stocks in 21 developed countries outside North America.
The MSCI Emerging Markets Index is a free float-adjusted market capitalization index that is designed to measure equity market performance in the global emerging markets.
U.S. Global Investors, Inc. is an investment adviser registered with the Securities and Exchange Commission ("SEC"). This does not mean that we are sponsored, recommended, or approved by the SEC, or that our abilities or qualifications in any respect have been passed upon by the SEC or any officer of the SEC.
This commentary should not be considered a solicitation or offering of any investment product.
Certain materials in this commentary may contain dated information. The information provided was current at the time of publication.