I have always been an advocate of learning to think for yourself and taking personal responsibility for trading decisions. Here is an example why.
Last Wednesday, J C Parets of All-Star Charts did a victory lap on his sell call on the healthcare ETF, Health Care Select Sector SPDR (NYSE:XLV):
Here is a daily candlestick chart of the SP Healthcare Index ETF $XLV showing why 75 was our upside target coming into the year. Members of EagleBaySolutions receive updates on this research several times a month. First of all, the last major correction we saw in healthcare was during the September/October decline where most of the U.S. equities market took a hit. That correction has been a great reference point for a lot of sectors and averages, not just healthcare. But today, we’re focused on the $XLV. $75 and change was exactly the 261.8% Fibonacci extension of that decline. But in addition, it was also the 4 point measured move target based on the consolidation from December through February before the breakout:
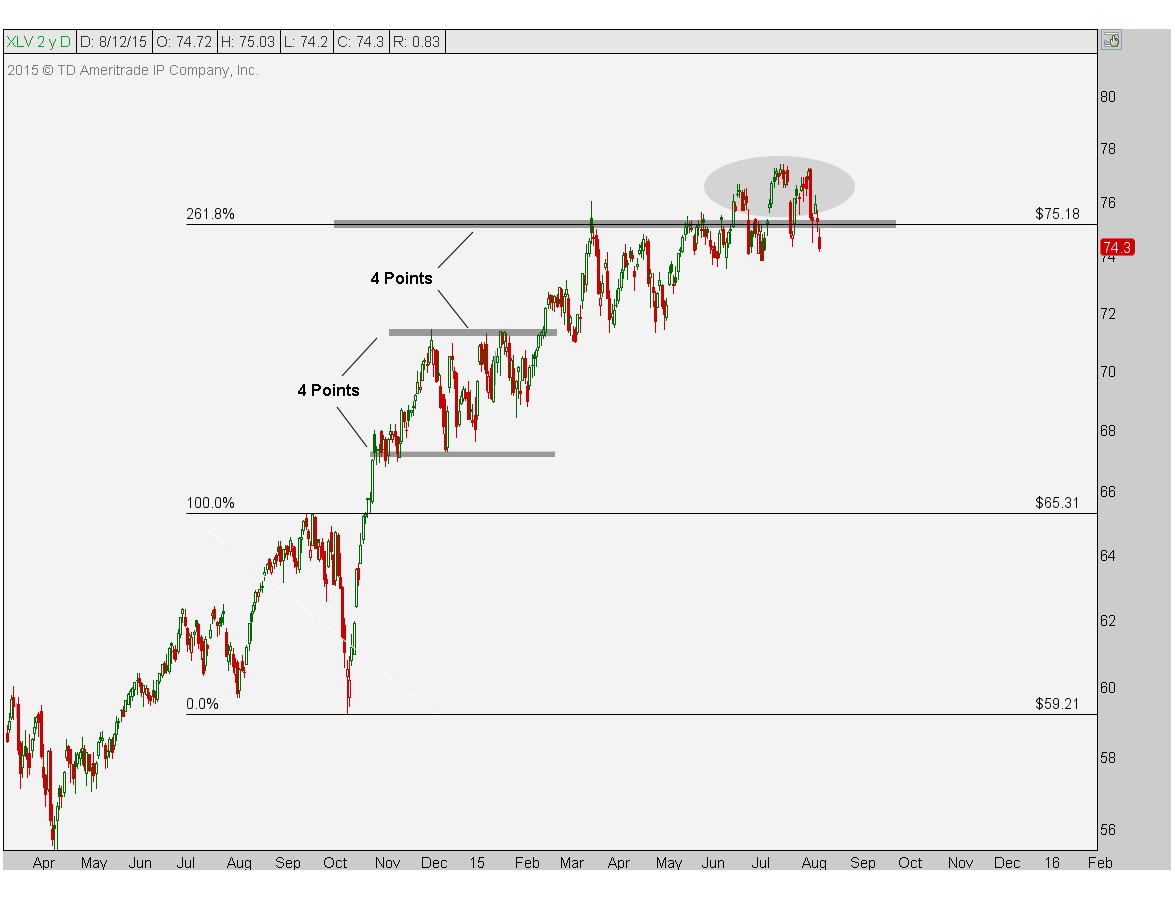
He concluded (emphasis added):
I don’t know what is going to happen in healthcare. No one does. I don’t claim to know something that others don’t. I’m simply asking the question: Is this the beginning of a severe correction for America’s most loved sector? You tell me. The weight of the evidence suggests to me that a short entry could be here. Our upside target in March was just over $75. I don’t see any reason to be short if prices are above that level. This makes the risk/reward very much skewed in favor of the bears and the risk is well-defined. To me, that’s what matters most.Price target-wise, where do I think we’re headed? $62-$64 in $XLV looks like a good area to take profits on shorts. This is the level where we broke out from in late October before healthcare made it’s (potentially) final run. This area is also where several Fibonacci levels cluster together, particularly the 261.8% extension of the entire 2007-2009 correction and the 38.2% retracement of the 2012-2015 rally. To me it’s where support/resistance levels and Fibonacci all come together. I would be covering shorts down there. This represents 14-18% lower from current prices.
Kudos to Parets for making the successful sell call on XLV, but to continue to hold a short position in the ETF may not be healthy for traders' bottom lines. Here's why.
Sector or market call?
I like to disaggregate calls based on different factors. In this case, it is unclear whether the sell/short XLV call was successful because the market went down or if the sector went down. In his analysis, Parets showed a couple of charts showing slowing XLV momentum in the form of a downtrend in the RSI indicator, both on the daily and weekly chart. Here is the same chart for the SPX on a daily basis which also shows declining RSI and an index that has been rolling over.
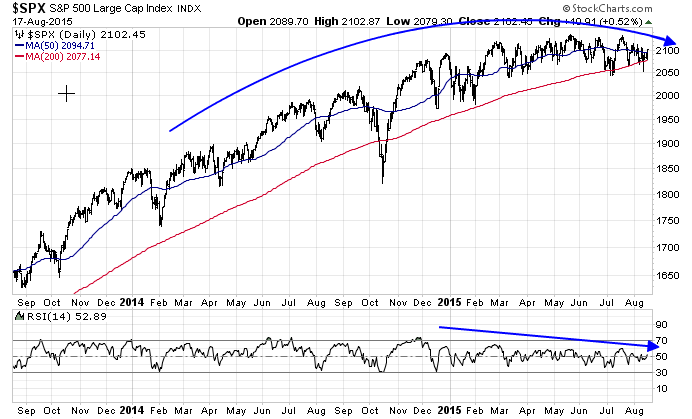
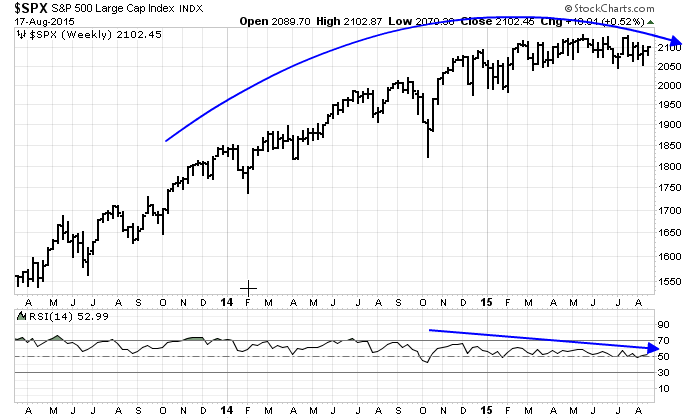
Here is the weekly SPX chart showing a similar pattern:
So was "sell XLV" a market call or sector call?
Too many bears
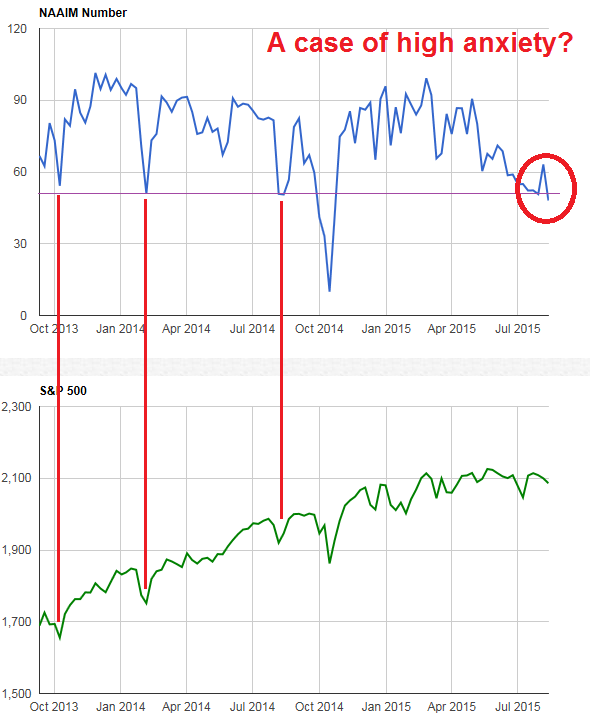
If it was a market call, I cautioned readers yesterday (see Groundhog Day) that a number of market sentiment models were flashing crowded short readings and past instances of such conditions have tended to lead to rallies.
Here is the NAAIM Exposure Index, which measures the sentiment of NAAIM members, who are RIAs managing individual client funds:
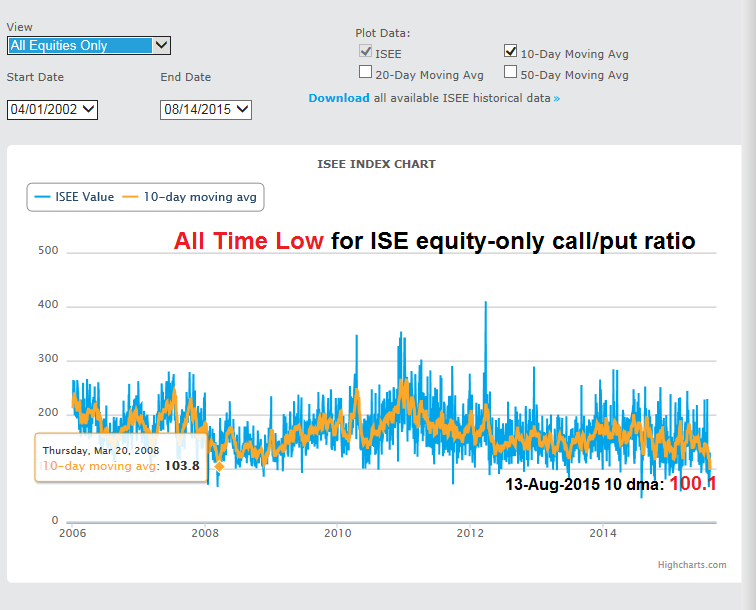
Here is the ISE equity-only call/put ratio, which measures the customer only opening trade transactions, whose 10 dma saw an all-time low last Thursday - lower than the readings seen in 2007 and 2008:
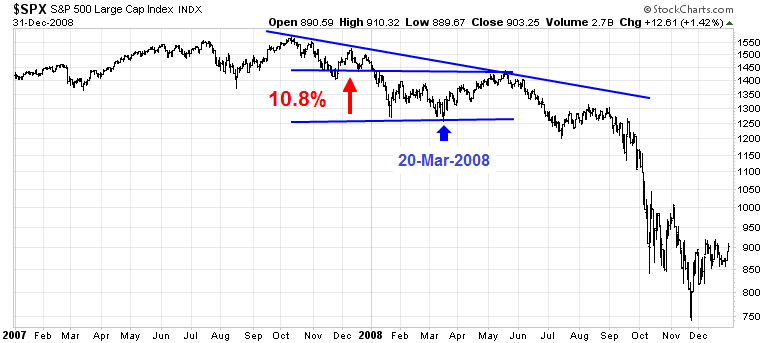
The next highest 10 dma reading I found was on March 20, 2008. As a reminder, the market proceeded to rally by 10.8% before retreating:
With sentiment this bearish, I'm not sure I want to be short here.
Was it a sector relative call?
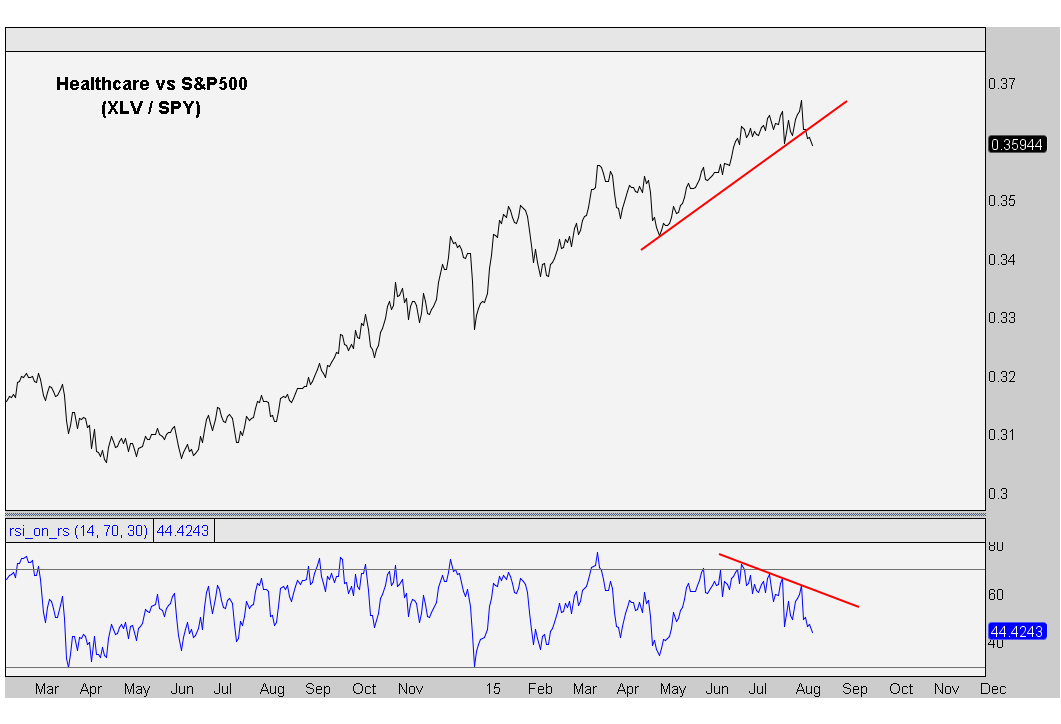
If the "sell XLV" call was a call that the Healthcare sector would do worse than the market, then we need to measure its relative performance. To his credit, Parets did show a XLV to SPDR S&P 500 (NYSE:SPY) ratio chart, which filters out the market effect, indicating a relative trend violation and slowing momentum.
However, here are the longer term market relative charts of XLV and its industry components. The top panel depicts the XLV to SPY ratio, which did violate a short-term uptrend (red line). The market relative charts of Healthcare industries (iShares US Healthcare Providers (NYSE:IHF)) also show some short-term relative uptrend violations in Biotech (iShares Nasdaq Biotechnology (NASDAQ:IBB)) and Pharmaceuticals (PowerShares Dynamic Pharmaceuticals (NYSE:PJP)). However, both the sector and its industry components remain in robust long-term relative uptrends (blue lines).
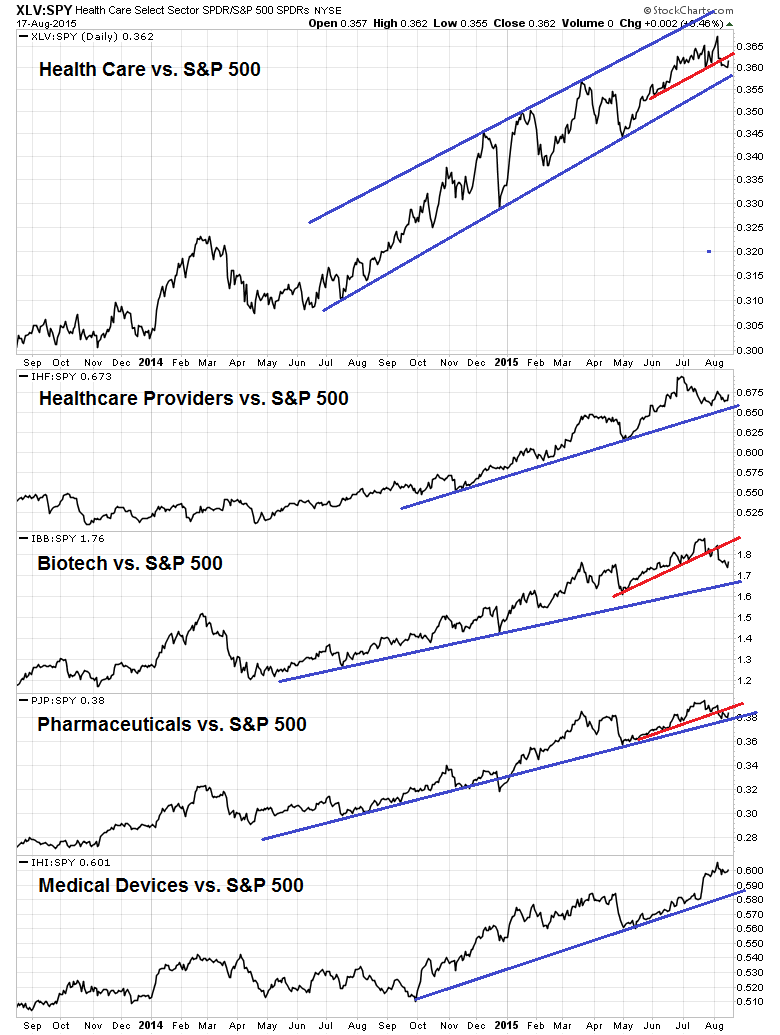
To be sure, XLV was overbought and due for a pullback. Parets should take a bow for highlighting that observation in his analysis. However, the superior relative performance of the Healthcare sector has been very broad based across many industries and shorting into that kind of relative strength would indeed be a courageous act. Until the longer term relative uptrends of the sector and its industry components are violated, the jury is still very much out on the relative performance outlook for healthcare.
While I am not wildly bullish on Healthcare, I certainly would not want to be short the sector here. The combination of a possible rally in the market, or even a recovery in the long-dated trend of positive relative performance, could really rip the face off any short seller.
The moral of this story: Learn to think critically about analysis that you read on the internet and don't automatically accept conclusions of others (and that includes what I write). Market analysis should not be some magic black box with a "buy" or "sell" conclusion based on the reputation or past track record of the analyst. Everyone will be wrong at some point. Understand the reasons for the investment and take responsibility for your own trading decisions.
Disclosure: Cam Hui is a portfolio manager at Qwest Investment Fund Management Ltd. ("Qwest"). This article is prepared by Mr. Hui as an outside business activity. As such, Qwest does not review or approve materials presented herein. The opinions and any recommendations expressed in this blog are those of the author and do not reflect the opinions or recommendations of Qwest.
None of the information or opinions expressed in this blog constitutes a solicitation for the purchase or sale of any security or other instrument. Nothing in this article constitutes investment advice and any recommendations that may be contained herein have not been based upon a consideration of the investment objectives, financial situation or particular needs of any specific recipient. Any purchase or sale activity in any securities or other instrument should be based upon your own analysis and conclusions. Past performance is not indicative of future results. Either Qwest or Mr. Hui may hold or control long or short positions in the securities or instruments mentioned.

