Altaba Inc (NASDAQ:AABA)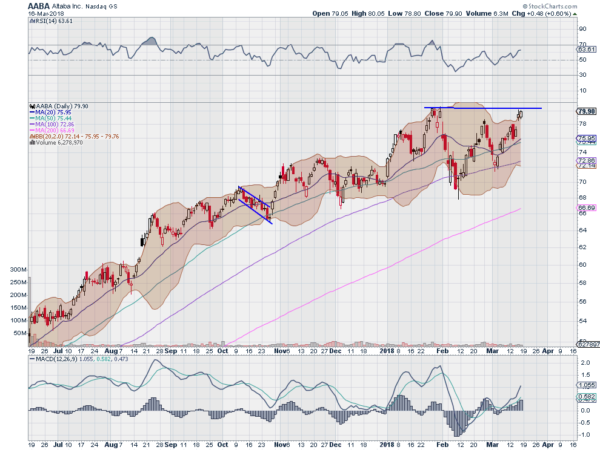
Altaba, $AABA, the former Yahoo (NASDAQ:AABA), started a move higher in the beginning of 2017. It slowed into the end of the year and then got mixed up in the volatility over the last 2 months. It pulled back to the 100 day SMA in February and bounced to a lower higher, only to fall back to the 100 day SMA against the beginning of March, a higher low. Not it making a higher high and near the all-tie high. The RSI is rising and bullish with the MACD rising and positive. Look for a push to a new high to participate…..
Dollar Tree (NASDAQ:DLTR)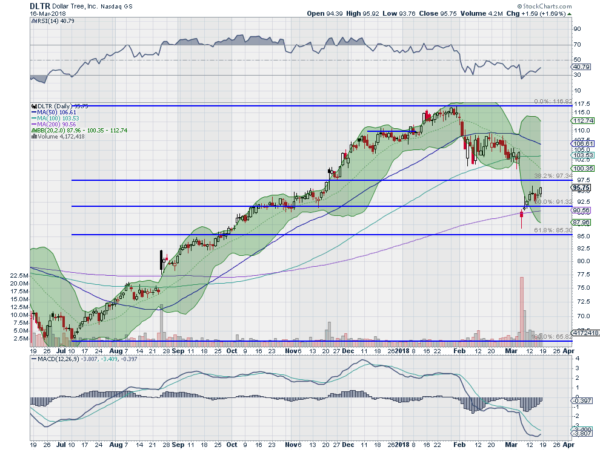
Dollar Tree, $DLTR, started to move higher in July 2017, reaching atop in January this year. It had a mild pullback near the 100 day SMA to start February, but then fell again following its earnings report with a gap down to the 200 day SMA. Since then it has been moving back up with a RSI that i pushing higher and a MACD moving to cross up. Look for continuation to participate higher…..
LPL Financial Holdings Inc (NASDAQ:LPLA)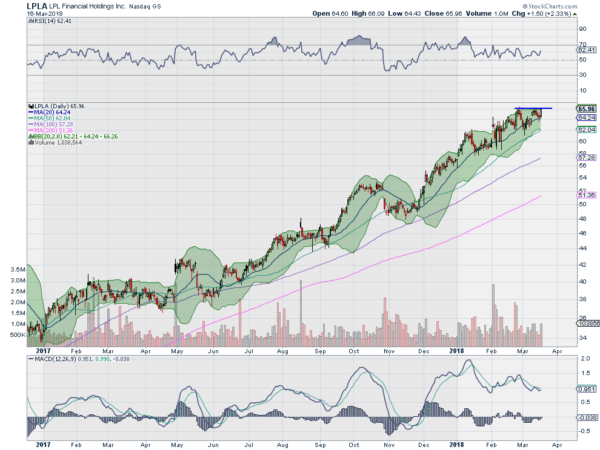
LPL Financial, $LPLA, has had a better than 2 year trend to the upside. It has paused and regrouped along the way, the latest time in November. With the market pullback it had just a minor hiccup and is now back at resistance. The RSI is in the bullish zone with the MACD trying to cross up but positive. Look for a push higher to participate…..
Phillips 66 (NYSE:PSX)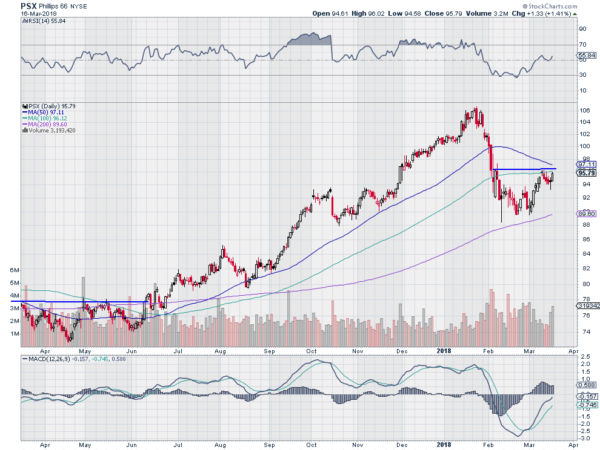
Phillips 66, $PSX, rounded out of a bottom last spring, moving higher to a top in January. It pulled back from there to the 200 day SMA and then bounced. A smaller pullback reversed at the end of last week and it is back at resistance. The RSI is pushing higher toward the bullish zone with the MACD rising and about to turn positive. Look for a push through resistance to continue higher…..
Visa Inc (NYSE:V)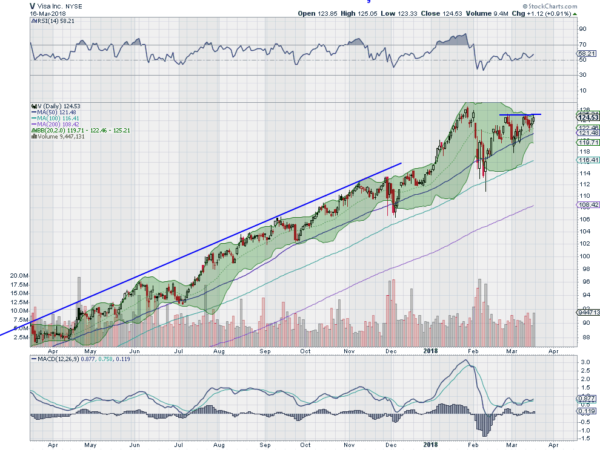
Visa, $V, ran higher through 2017 and accelerated into January of this year. It pulled back with the market, finding support at the 100 day SMA and bouncing. It has been riding the 50 day SMA higher ever since. Now it is at resistance with the RSI bullish and rising and the MACD positive and moving higher. Look for a push over resistance to participate higher…..
Up Next: Bonus Idea
After reviewing over 1,000 charts, I have found some good setups for the week. These were selected and should be viewed in the context of the broad Market Macro picture reviewed Friday which with March Options Expiration done and spring around the corner sees the Equity Index ETF’s looking mixed but positive.
Elsewhere look for Gold to consolidate with a downward bias while Crude Oil consolidates in a tight range. The US Dollar Index is also consolidating in a downtrend, trying hard to reverse it, while US Treasuries are showing signs of a potential reversal to the upside. The Shanghai Composite and Emerging Markets continue to consolidate, the former around long term support and resistance, and the latter at the highs.
Volatility looks to continue to drift lower easing the pressure on the equity markets. Their charts all show retrenchment in the short term, with the iShares Russell 2000 (NYSE:IWM) trying to reverse and lead them all higher. On the longer picture the IWM and PowerShares QQQ Trust Series 1 (NASDAQ:QQQ) look strong with the SPDR S&P 500 (NYSE:SPY) stuck in broad consolidation. Use this information as you prepare for the coming week and trad’em well.
DISCLAIMER: The information in this blog post represents my own opinions and does not contain a recommendation for any particular security or investment. I or my affiliates may hold positions or other interests in securities mentioned in the Blog, please see my Disclaimer page for my full disclaimer.
