Selloff or Market Correction? Either Way, Here's What to Do NextSee Overvalued Stocks

Ahead Of Friday’s U.S. Open

Published 07/18/2014, 03:07 AM
Updated 07/09/2023, 06:31 AM
US500
-
IXIC
-
VIX
-
HAC
-

Upcoming US Events for Today:

  1. Consumer Sentiment for July will be released at 9:55am. The market expects 83.0 versus 82.5 previous.
  2. Leading Indicators for June will be released at 10:00am. The market expects a month-over-month increase of 0.5%, consistent with the previous report.

Upcoming International Events for Today:

  1. Canadian CPI for June will be released at 8:30am EST. The market expects a year-over-year increase of 2.4% versus an increase of 2.3% previous.
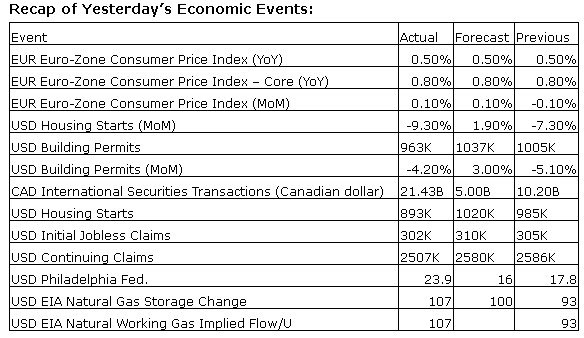
Thursday's Economic Events

The Markets

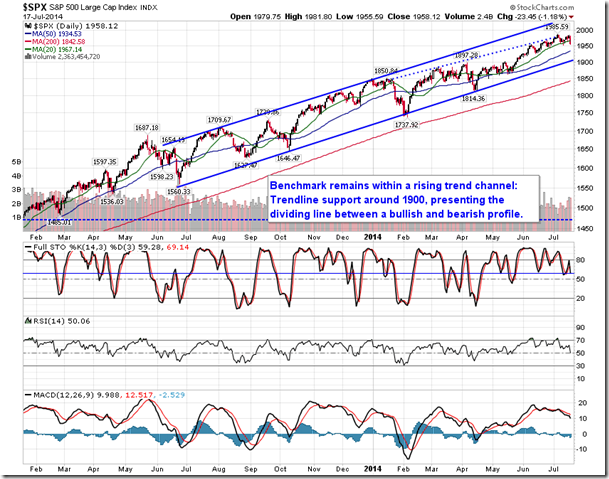
Tough day for stocks as investors reacted to news of a civilian airline shot down over Ukraine.   Both the S&P 500 and NASDAQ Composite shed more than 1%, trading below their 20-day moving averages for the first time since mid-May.   Turning to the hourly chart of the S&P 500, double top resistance around 1985 has become apparent; momentum indicators have negatively diverged from price over the past month and a half, suggesting waning short-term upside strength.   A level of support below the broken 20-day average can be found around 1952, below which support at the 50-day is the next logical test should the event risks prove to be too much for the positive trend of the equity market.   As investors continue to digest the news that is being released, it remains premature to speculate on a potential target over the near-term.
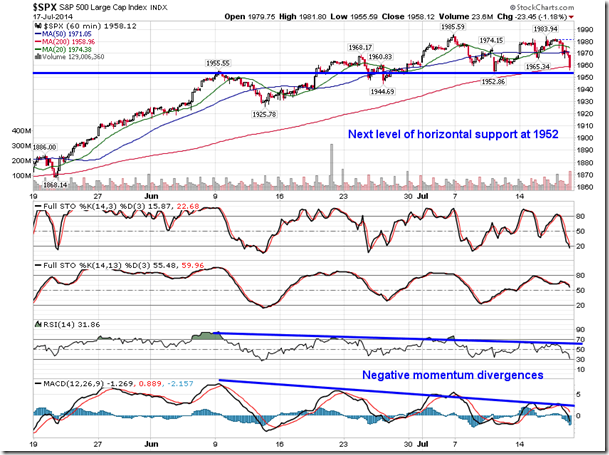
The S&P 500

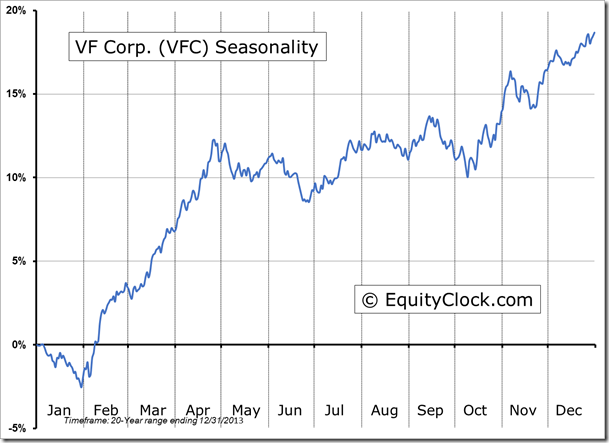
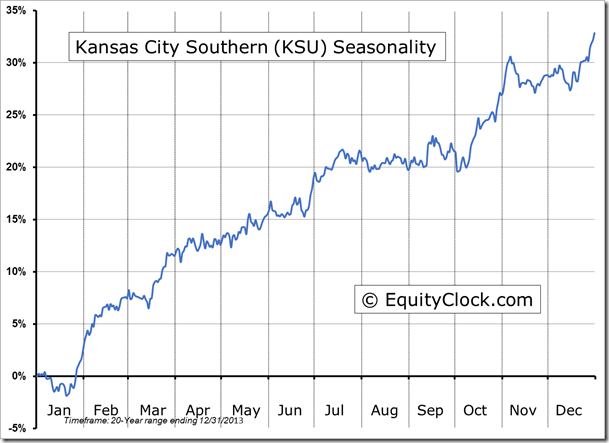
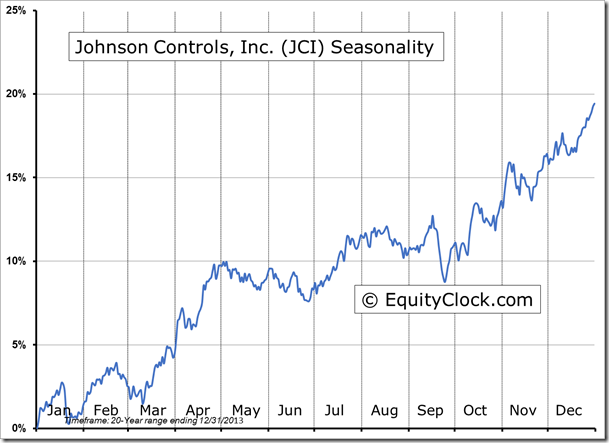
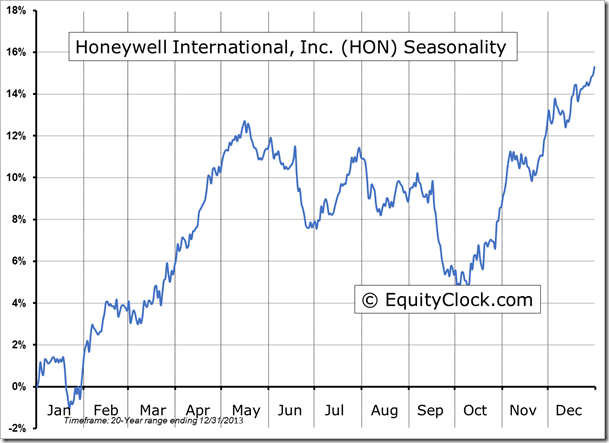
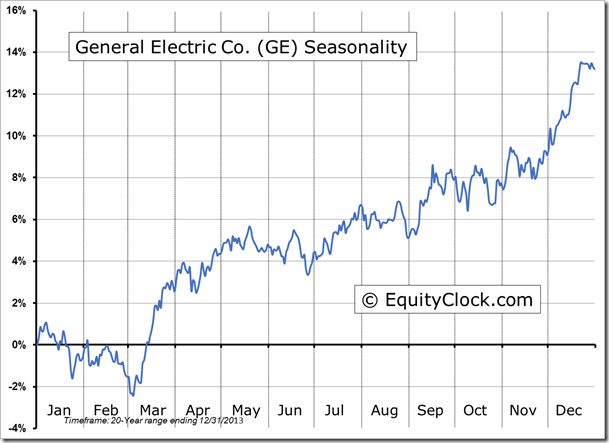
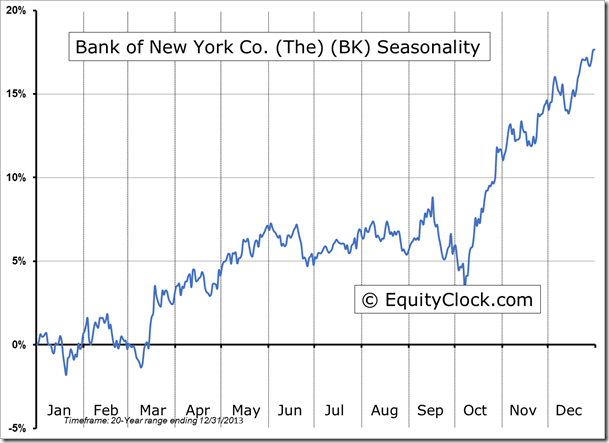
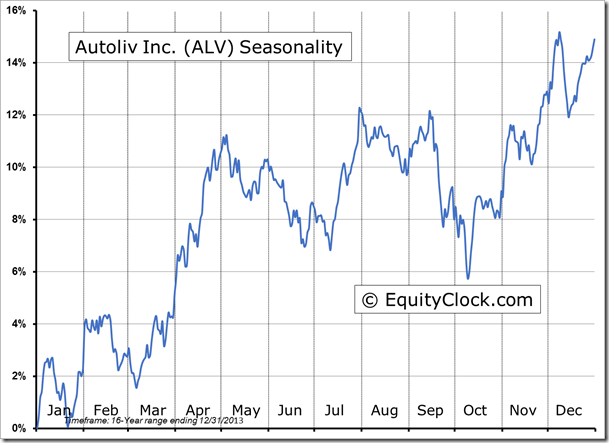
Seasonal charts of companies reporting earnings today:
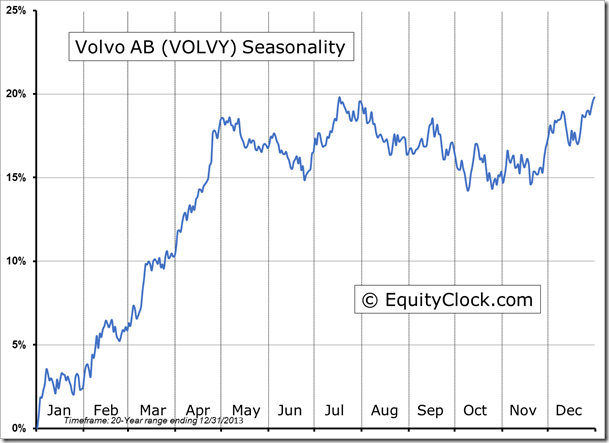
Volvo

VFC

KSU

JCI

HON

GE

BK

ALV

Sentiment on Thursday, as gauged by the put-call ratio, ended neutral at 1.00.   With the event risk that fuelled the selloff on Thursday, the Volatility Index (VIX) spiked over 32% to close at the highest level since April as investors sought put options to protect portfolio positions.   Both the VIX and the put-call ratio are pointing to bearish trends as the level of cautiousness amongst investors grows.
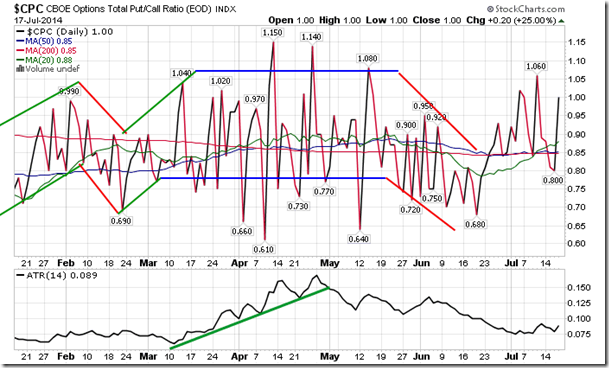
CBOE

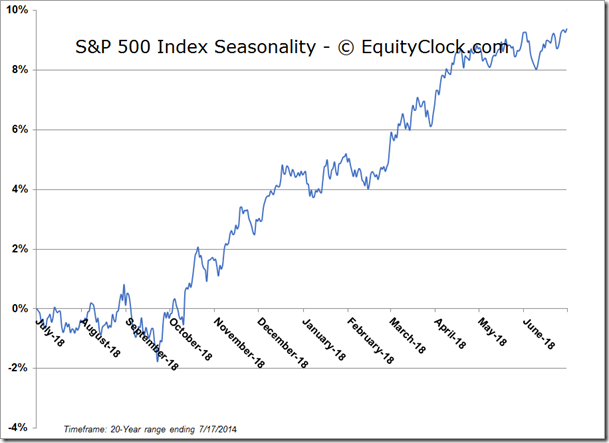
S&P 500

image

S&P 500 Seasonality

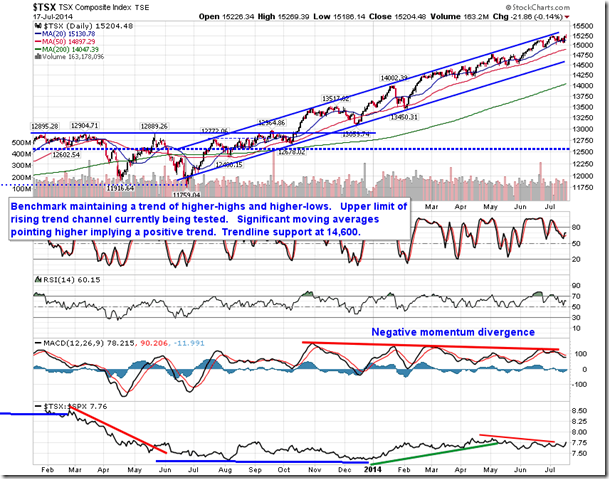
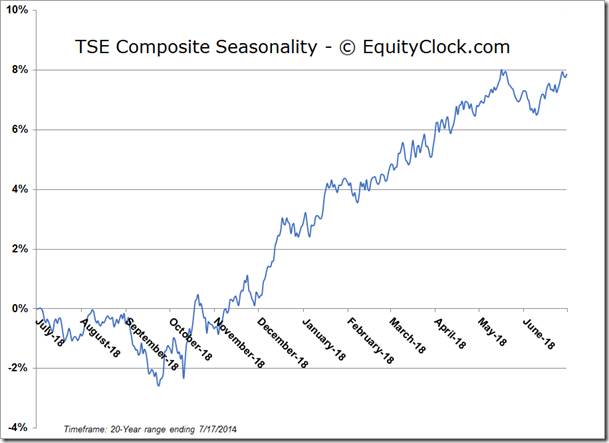
TSE Composite

TSX Composite

TSE Composite Seasonality

 Horizons Seasonal Rotation ETF (TO:HAC)

  • Closing Market Value: $14.75 (up 0.07%)
  • Closing NAV/Unit: $14.72 (down 0.13%)

Performance*

  2014 Year-to-Date Since Inception (Nov 19, 2009)
HAC.TO 2.94% 47.2%

* performance calculated on Closing NAV/Unit as provided by custodian
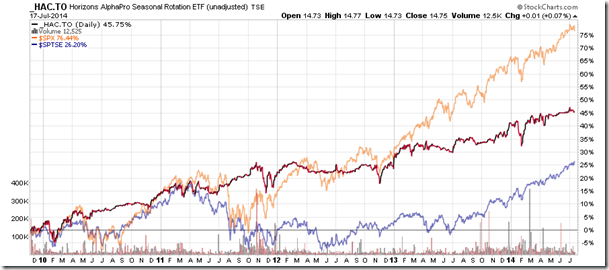
HAC_TO

Latest comments

Loading next article…
Risk Disclosure: Trading in financial instruments and/or cryptocurrencies involves high risks including the risk of losing some, or all, of your investment amount, and may not be suitable for all investors. Prices of cryptocurrencies are extremely volatile and may be affected by external factors such as financial, regulatory or political events. Trading on margin increases the financial risks.
Before deciding to trade in financial instrument or cryptocurrencies you should be fully informed of the risks and costs associated with trading the financial markets, carefully consider your investment objectives, level of experience, and risk appetite, and seek professional advice where needed.
Fusion Media would like to remind you that the data contained in this website is not necessarily real-time nor accurate. The data and prices on the website are not necessarily provided by any market or exchange, but may be provided by market makers, and so prices may not be accurate and may differ from the actual price at any given market, meaning prices are indicative and not appropriate for trading purposes. Fusion Media and any provider of the data contained in this website will not accept liability for any loss or damage as a result of your trading, or your reliance on the information contained within this website.
It is prohibited to use, store, reproduce, display, modify, transmit or distribute the data contained in this website without the explicit prior written permission of Fusion Media and/or the data provider. All intellectual property rights are reserved by the providers and/or the exchange providing the data contained in this website.
Fusion Media may be compensated by the advertisers that appear on the website, based on your interaction with the advertisements or advertisers.
© 2007-2024 - Fusion Media Limited. All Rights Reserved.