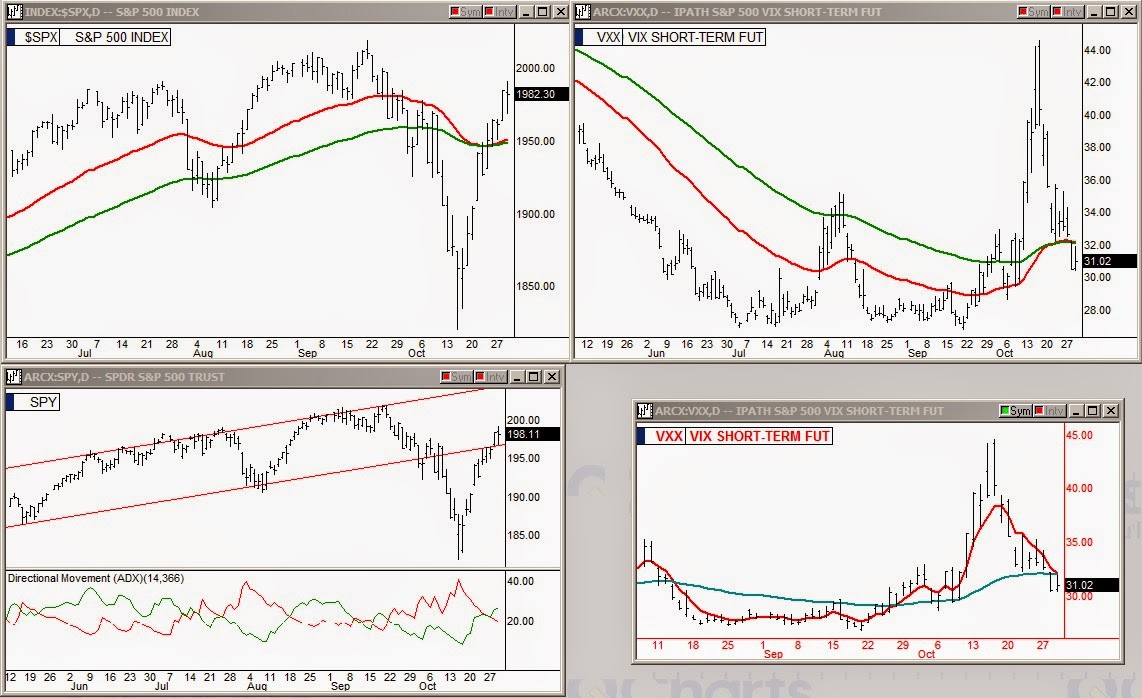
In the market Wednesday we had a FED statement that was decidedly less dovish or more hawkish depending on whether you are a bull or bear but everyone agrees that they have tightened their view. The afternoon trading was pretty much paralyzed as one key chart needs to resolve itself before traders and investors can see which direction the next market move will be. That chart is the ipath S&P 500 Vix, iPath S&P 500 Vix Short Term Fut (ARCA:VXX) with the 5 and 50 EMAs applied which I have highlighted in red in the bottom right corner of the chart cluster above. The red line is the 5 EMA and the turquoise line is the 50 EMA line. These two lines come to a juncture forming another EMA pivot for the market. If the market is up Thursday, the 5 EMA line will likely start to cross down through the 50 EMA line allowing stocks to rise but if the market is negative we could have a "v" bounce begin at the line juncture which would cause a quick reversal downward in the stock market. The bears are eyeing this chart closely and would be more than happy to take the market back from Team Yellen the bulls.

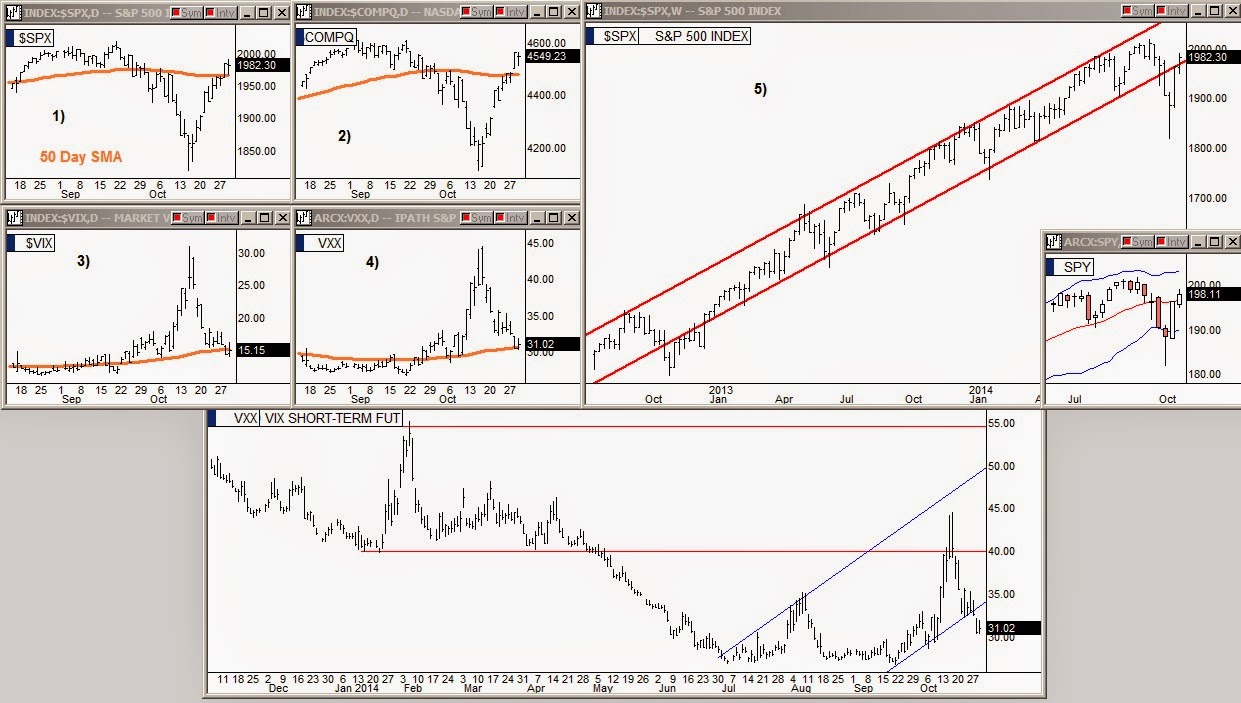
In the second chart cluster just above, the S&P is still inside of the bubble channel after Wednesday's drift lower. Tuesday's low in the VXX held again today.

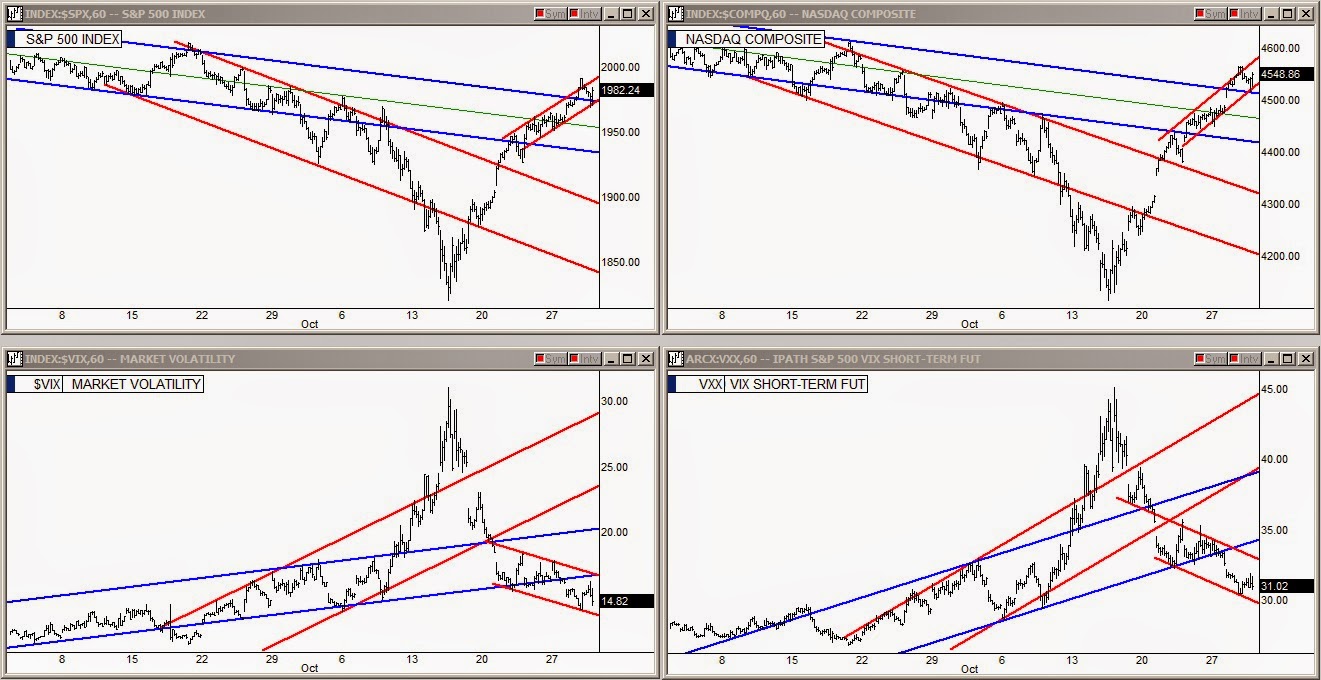
In the short term channel charts above, it can be seen that the S&P and NASDAQ have clearly started a new uphill channel and both got back out of their blue down hill channels in the last hour after a brief dip during the Fed statement. The VIX (Volatility Index) and VXX are working within taller downhill channels.
The VXX 5/50 juncture will be key for the next couple of days in determining where the market will go from here.
