Aflac (NYSE:AFL) is one of only 2 insurance stocks in the Dividend Aristocrats Index. The company is the global leader in cancer insurance, and has paid increasing dividends for 33 consecutive years.
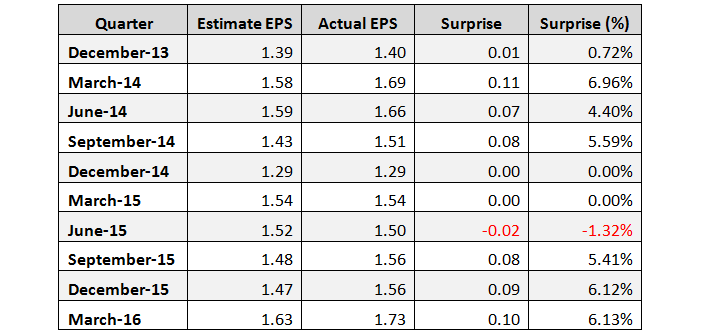
On April 26, AFLAC reported strong first quarter 2016 financial results, which beat earnings-per-share expectations by $0.10 (6.1%). Total revenue increased 4.3% year over year to $5.45 billion due to a stronger yen-dollar exchange rate. Revenues also surpassed consensus estimate of $5.23 billion.
Aflac showed earnings per share surprise in its three last quarters after missing estimates in the previous quarter, as shown in the table below.

Aflac, the largest provider of individual insurance in Japan and the leading provider of voluntary insurance at the worksite in the United States, has its primary business is in Japan.In fact, about 70% of the company’s total revenues in the last quarter came from Japan.
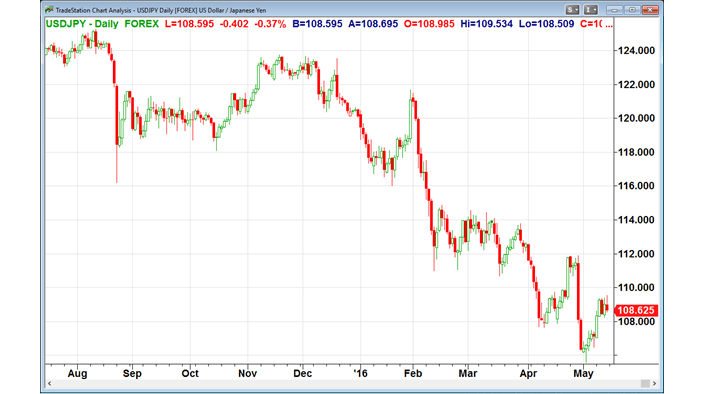
As such, Aflac’s financial results depend heavily on the yen-dollar exchange rate. The latest trend of the stronger yen is favoring the company’s revenues and earnings in dollar terms. Aflac Japan’s yen-denominated income statement is translated from yen into dollars using an average exchange rate for the reporting period. The average yen-dollar exchange rate in the first quarter of 2016 was 115.35, or 3.30% stronger than the average rate of 119.16 in the first quarter of 2015. Moreover, The average yen-dollar exchange rate thus far in the current quarter is 108.99, or 5.84% stronger than the average rate of the previous quarter.
As such, we can expect higher revenues and earnings in the current quarter due to the even greater strengthening of the yen in the current quarter.

* Thus far in Q2’2016

Commenting on the company’s first quarter results, Chairman and Chief Executive Officer Daniel P. Amos stated:
We are pleased with our overall financial results in the first quarter of 2016. Aflac Japan, our largest earnings contributor, generated solid financial results in yen terms for the quarter. Sales of first sector products were elevated in the quarter, consistent with our expectations. As we further implement various measures later in the quarter, we expect to see a sharp decline in first sector sales in the second half of the year. Although sales of Aflac Japan’s third sector products were up 1.0% in the quarter, you’ll recall we communicated in February that we anticipate sales of third sector products will be down mid-single digits for the full year following very robust production results in 2015. While it’s early in the year, we are running ahead of expectations for sales of third sector products as of the end of the first quarter. We continue to believe the long-term compound annual growth rate for third sector products will be in the range of 4% to 6%.
In the first quarter, Aflac U.S. produced solid financial and sales results. We continue to believe that the changes we made to our career and broker management infrastructure have created a foundation for greater long-term growth opportunities. The increase in new annualized premium sales of 3.7% establishes a solid baseline for our expectation of a 3% to 5% growth rate for the U.S. in 2016. Keep in mind, we anticipate the achievement of our annual U.S. sales target will be increasingly reliant on fourth quarter production.
Outlook
Aflac reiterated that its annual objective was to produce operating earnings per diluted share of $6.17 to $6.41, assuming the 2015 average exchange rate of 120.99 yen to the dollar.
If the yen averages 105 to 115 yen to the dollar for the second quarter, the company would expect earnings in the second quarter to be approximate $1.55 to $1.82 per diluted share. Since thus far in the current quarter the yen has averaged at 109 yen to the dollar, we can expect earnings near the top of this range.
Dividend
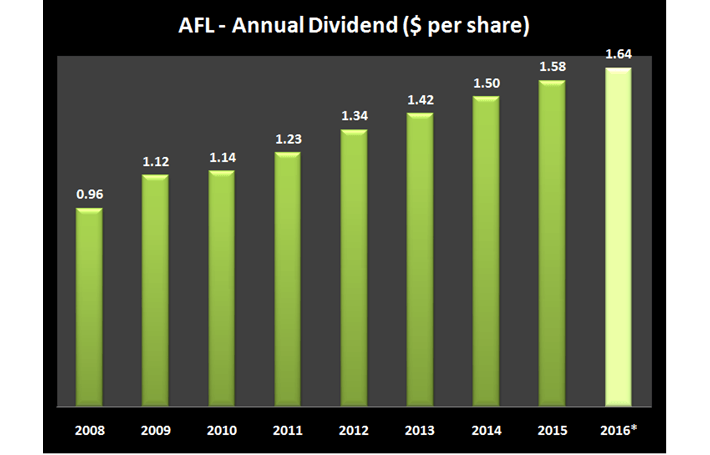
Aflac has paid increasing dividends for 33 consecutive years. The second quarter dividend is payable on June 1, 2016, to shareholders of record at the close of business on May 18, 2016. The forward annual dividend yield is at 2.4%, and the payout ratio is only 26.2%.
The annual rate of dividend growth over the past three years was at 5.6%, over the past five years was at 6.7%, and over the last ten years was high at 13.6%.
Source: company’s reports *assuming same dividend rate for the year

In the first quarter, Aflac repurchased $600 million, or 10.2 million of its common shares. At the end of March, the company had 38.2 million shares available for purchase under its share repurchase authorizations.
Growth
In my opinion, Aflac’s growth prospects are still firm.
According to the company, sales of cancer insurance in Japan continue to be extremely strong following the introduction of the end of the third quarter of 2015 the new cancer days products, which includes an exclusive policy sold for Japan Post. In the first quarter of 2016, the company introduced a cancer insurance product designed for those who have previously been diagnosed with cancer and been cancer-free for five years, just as it does in the United States, as well as an enhanced nonstandard medical insurance product.
According to Aflac, it will continue to be innovative in its providing options that millions of Japanese consumers are looking for as they struggle to bear the financial burdens of higher medical expenses. All of Aflac’s alliance partners continue to produce strong results, and the company is especially pleased with Japan Post and their 20,000-plus postal outlets selling Aflac’s cancer insurance.
In the U.S., the company has made changes to its sales organization to enhance it sales growth. Aflac sees 2016 as the year of stabilization and growth and continues to execute on its strategies. With Aflac generating new annualized premium sales of 3.7%, it is off to a good start toward its expectation of a 3% to 5% sales growth for the U.S. in 2016.
Valuation
Since the beginning of the year, AFL’s stock is up 15.0% while the S&P 500 Index has increased 0.1%, and the Nasdaq Composite Index has lost 5.8%.
However, since the beginning of 2012, AFL’s stock has gained only 59.2%. In this period, the S&P 500 Index has increased 62.7% and the Nasdaq Composite Index has gained 81.1%.
According to TipRanks, the average target price of the top analysts is at $71.67, an upside of 4.1% from its May 13 close price, however, in my opinion, shares could go higher.
AFL’s valuation metrics are excellent, the trailing P/E is very low at 11.3, and the forward P/E is even lower at 9.9. The price-to-free-cash-flow is extremely low at 4.75, and the enterprise value/EBITDA ratio is also very low at 6.87.
According to James P. O’Shaughnessy, the Enterprise Value/EBITDA ratio is the best-performing single value factor. In his impressive book “What Works on Wall Street,” Mr. O’Shaughnessy demonstrates that 46 years back testing, from 1963 to 2009, have shown that companies with the lowest EV/EBITDA ratio have given the best return.
Ranking
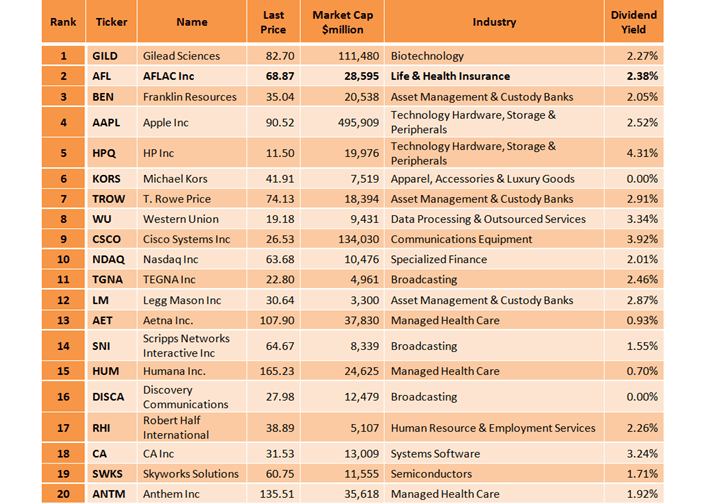
According to Portfolio123’s “All-Stars: Greenblatt” ranking system, AFL’s stock is ranked second among all S&P 500 stocks.

The “All-Stars: Greenblatt” ranking system is taking into account just two factors; Return on Capital and Earnings Yield (E/P) in equal proportions. Back-testing has proved that this ranking system is one of the best free available ranking method. I recommend investors to read Joel Greenblatt’s book “The Little Book That Beats the Market“, where he thoroughly explains his system.
Summary
Aflac delivered another strong quarter financial results which beat EPS expectations by $0.10 (6.1%), the company showed earnings per share surprise in its three last quarters. The average yen-dollar exchange rate thus far in the current quarter is 5.84% stronger than the average rate of the previous quarter.
As such, we can expect higher revenues and earnings in the current quarter. AFL’s valuation metrics are excellent, the forward P/E is very low at 9.9, and the EV/EBITDA ratio is also very low at 6.9. Aflac is generating strong free cash flows, and returns substantial capital to its shareholders by stock buybacks and by increasing dividend payments; Aflac has raised its annual dividend for 33 consecutive years. In addition, the company ranks in the top 40% of high quality dividend stocks using The 8 Rules of Dividend Investing.
All these factors bring me to the conclusion that AFL’s stock is a smart long-term investment.
