On The Radar
Looking around the traps today, it’s a somewhat messy affair, although the NZD has spiked 90-pips higher after the RBNZ failed to meet the markets dovish pricing structure on future policy moves.
USD/CNH is the center of my world at this juncture though, and as we can see in the price action, there is a battle going on between market participants, with no clear party prepared to stamp their authority. Take a look at yesterday’s candle, where we saw price trade above Monday’s high with the short-term USD bullish trend continuing in earnest. The highs didn’t last long though, and CNH strength kicked in, with price closing below Monday's opening level, but unable to take out the lows.
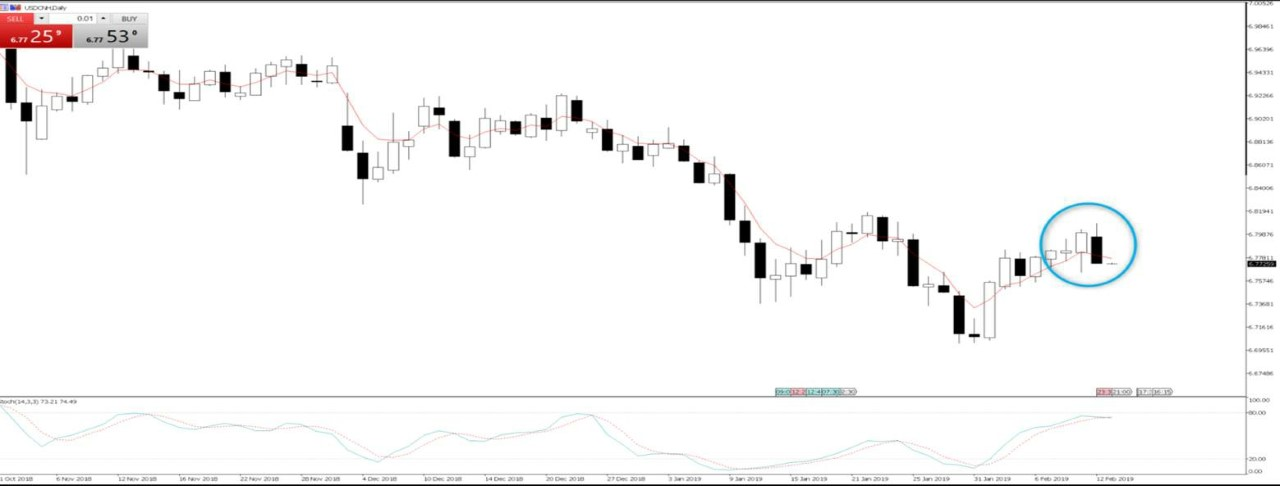
It’s this strength in the CNH that has put a bid in the AUD, with the AUD/USD gaining further fuel today after Westpac consumer confidence rebounded 4.3% in February, as well feeding off the moves in the NZD, with AUD/USD reaching a session high of 0.7125.
Keep the USD/CNH cross on the radar though, as it’s a decent barometer of the broad feel to trade Sino-U.S. relations. As a basic guide, if we feel optimistic about a potential trade deal, that is, after the 1 March deadline is extended, then USD/CNH should fall and vice versa.
Consensus Macro Concerns
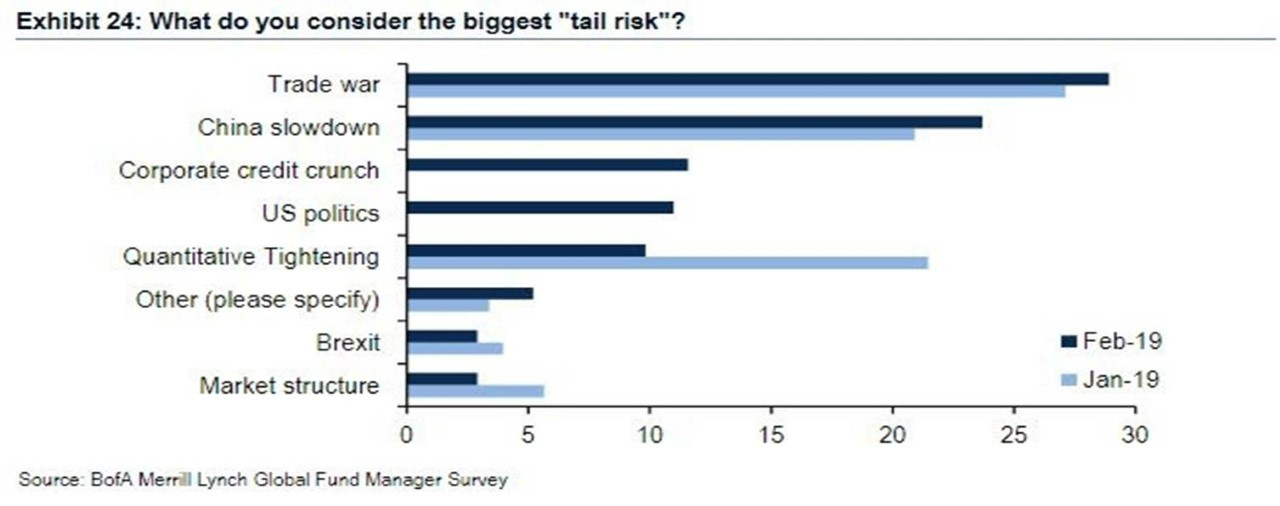
As we can see from the Monthly BoA/ML Global Fund Managers’ Survey, which gets a lot of focus as the respondents manage a sizeable chunk of the world’s invested capital, we can see the number one concern out there is the China/U.S. trade tensions. Hard to disagree with this view, especially when the likes of BoE governor Carney came out with a speech yesterday simply titled “The Global Outlook.”
In the speech, Carney spoke openly about the sizeable impact on the Chinese economy should the full suite of goods face tariffs of 25%. There is little doubt Fed chair Powell, and RBA governor Lowe shares this concern too.
A Turning Point In EUR/USD?
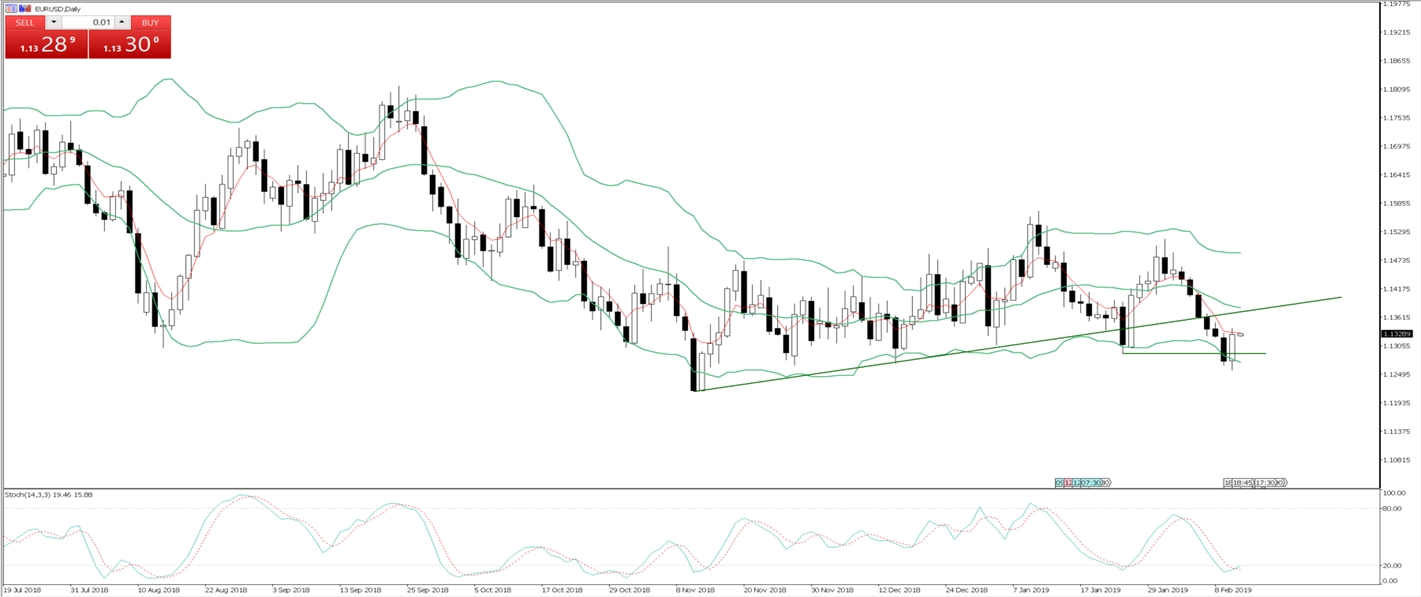
We’ve seen a better feel to EUR/USD, and I would urge caution on shorts in the pair here, as we see signs of a follow-through buying in today's session. A close through the 5-day EMA would suggest a test of the recent November trend, and that is where things would get interesting.
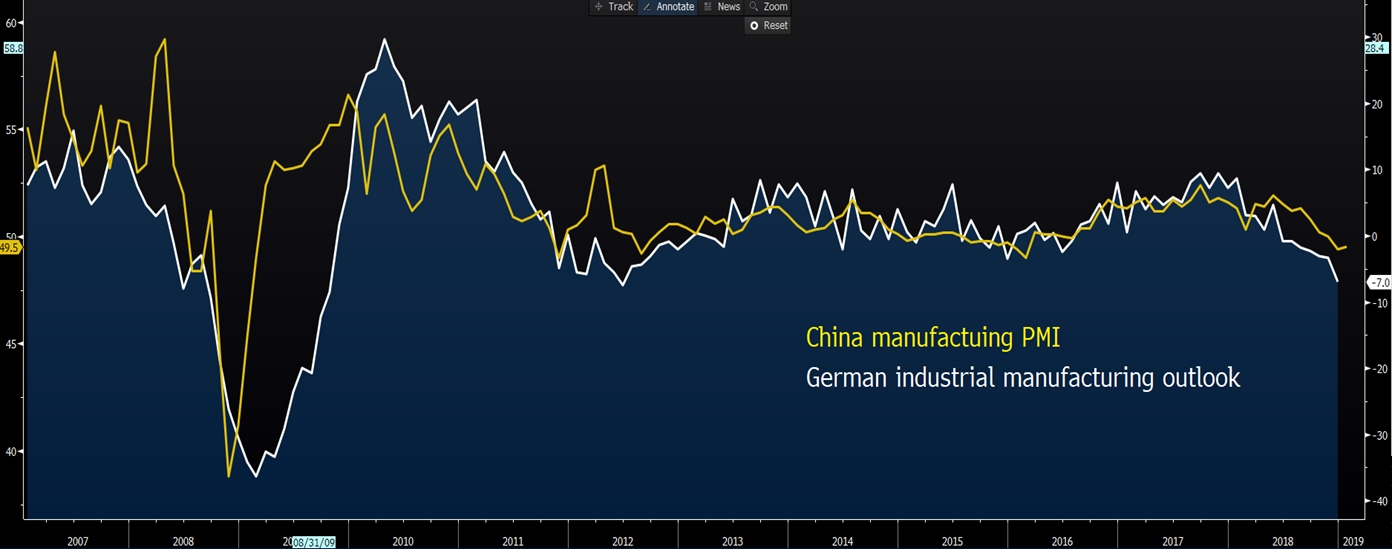
The case for economic weakness in Europe is well known, but, as the Bloomberg chart shows China has been a considerable influence in dragging the European economy into the doldrums - although there are other domestic factors which have also been in play.
Here, I have chosen to look at the correlation between China’s manufacturing PMI and German industrial output, with China’s data leading. The next China PMI data print is seen on the 28 February, so we can deduce that if this data point improves then, we will see a ‘Europe is less bad trade’ play out. China releases its M2 Money Supply this week (no set time), and again should we see this move higher from the current level of 8.1% it should help sentiment. Of course, it doesn’t solve the real issue, and that is a positive outcome to trade talks.
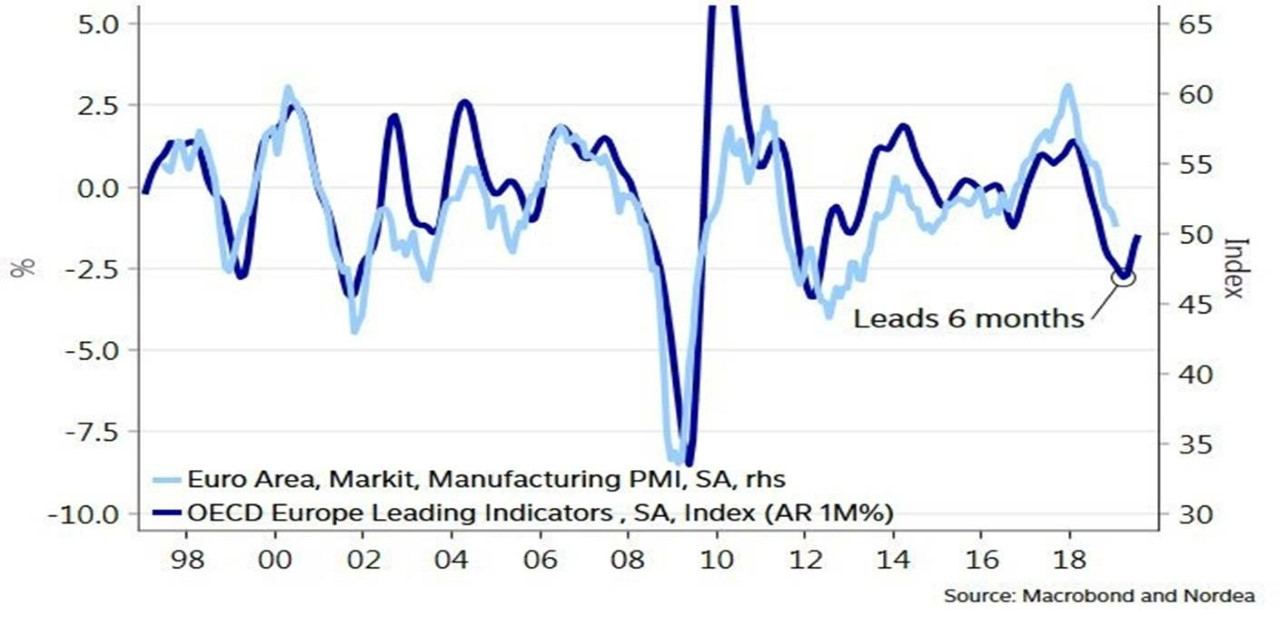
Another chart which would give EUR bulls some hope is this one from Nordea Research. Here, we can see the first major swing in the OECD Europe leading index suggests better days ahead for Europe. Better days ahead?
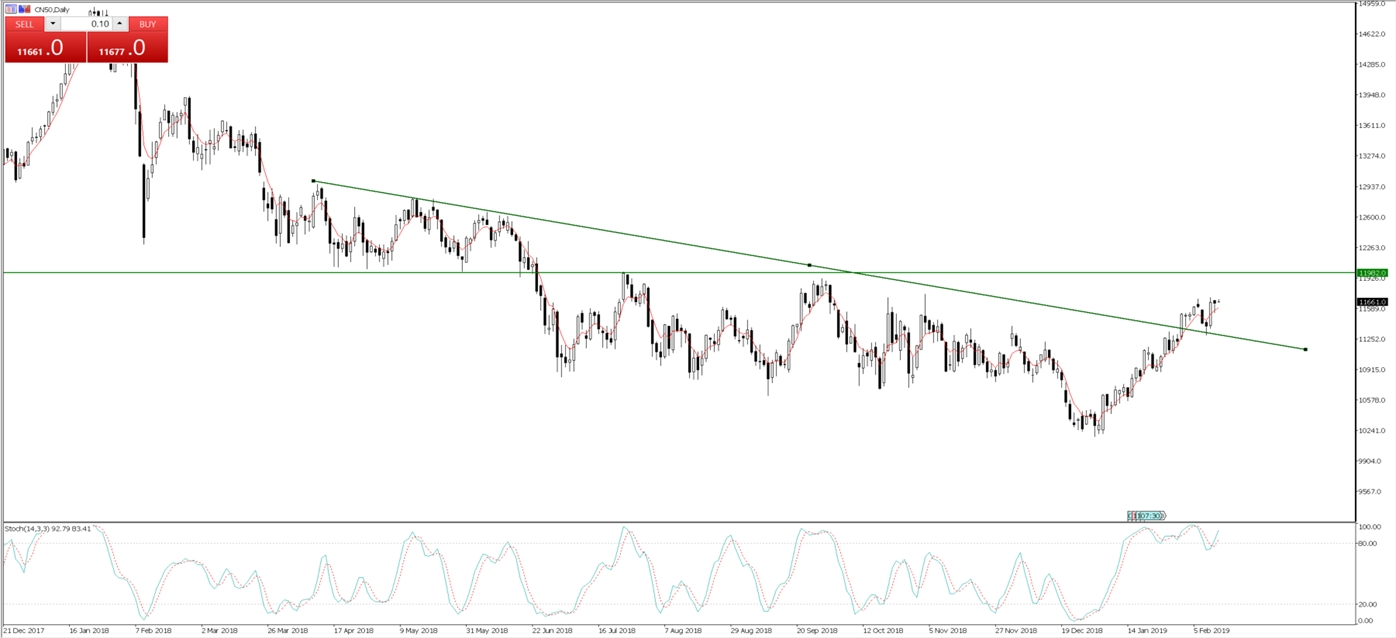
Staying on the China space, there is a genuine bullish feel emerging to the various equity indices. The Hang Seng looks unassailable bullish, but the China A50 index(CN50 on MT5) is also looking upbeat.
I’ve looked at the daily chart here, but we have seen a shift in momentum on the monthly too, with a bullish stochastic crossover. On this set-up, it feels as though we can squeeze into 11,980 and horizontal resistance.
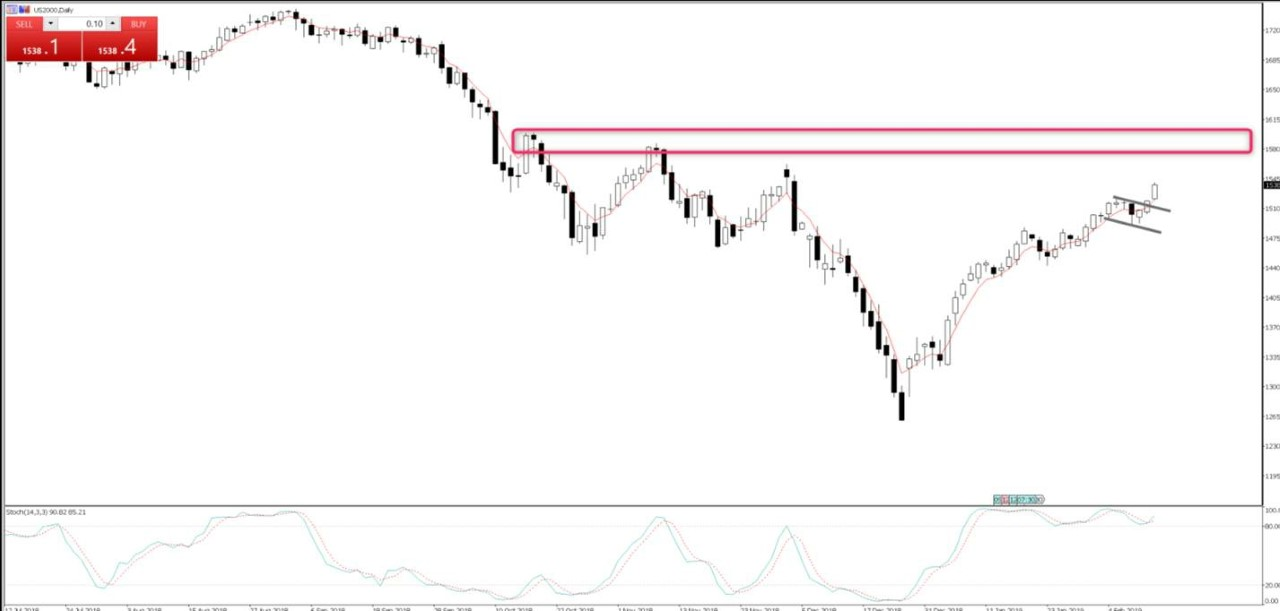
Russell 2000 (U.S. SmallCap 2000) – The trend is your friend here. U.S. equities are no different, and the bulls are in control. I have looked at small caps here, but you can pick the S&P 500.
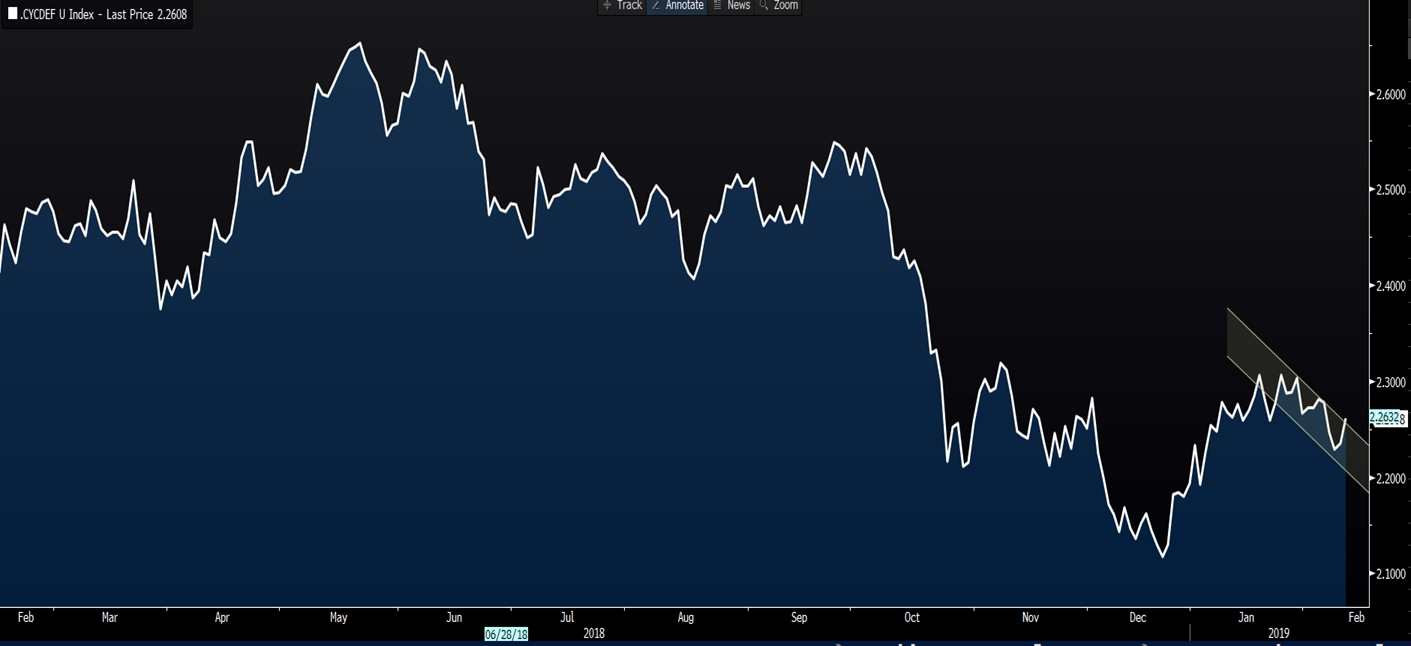
While I will look at various models that all generally assess sentiment and probability, one chart that does concern in equity land is that the cyclical/defence sector ratio is making a series of lower lows. In a genuinely bullish set-up we would want to see cyclical sectors of the market outperform. One I will monitor, but it takes some of the gloss of the recent rally.
