A Technology Led Sell-Off May Send Stocks Lower In September

Published 09/03/2020, 07:38 AM
EUR/USD
-
NDX
-
XAU/USD
-
QQQ
-
ADBE
-
AAPL
-
DX
-
GC
-
TSLA
-
XLK
-
SHOP
-

NASDAQ 100

Stocks in the US are pulling back some today, especially in the NASDAQ 100. The QQQ are down about 80 basis points, which is nothing considering how much they are up just this week. But given the size of the move in recent weeks and its location on the charts, it wouldn’t be surprising to see this turn into something more, with the first level of support around $291, then $284, and $278. A 9% drop from where we closed on Wednesday is possible, and still, keep the ETF in the uptrend.
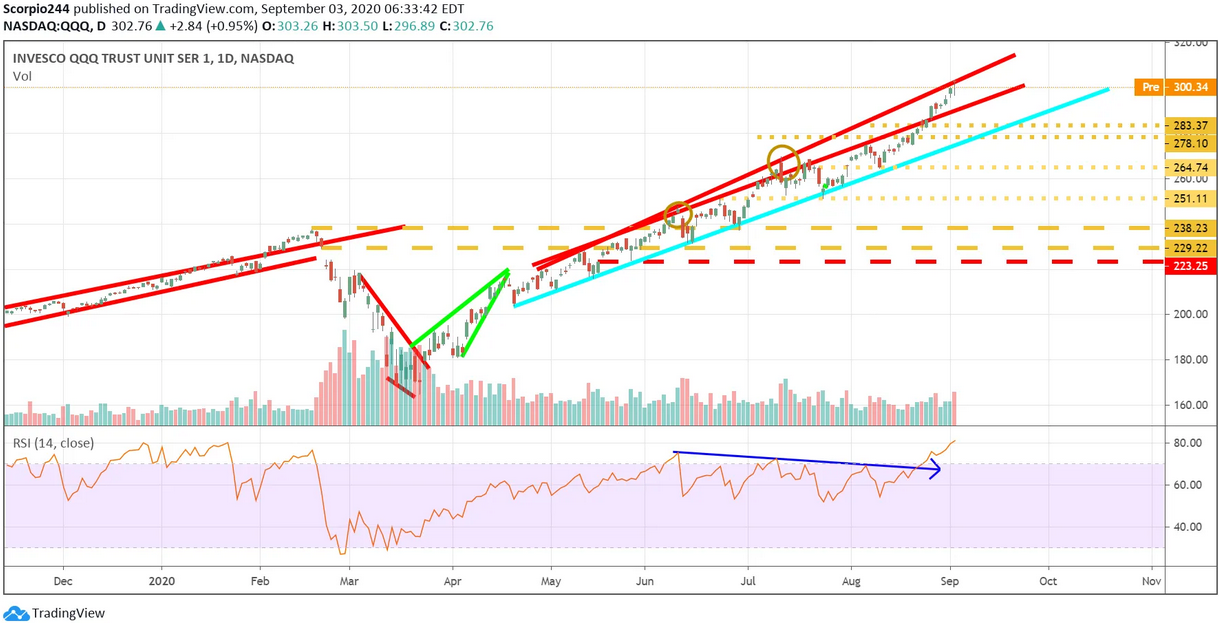
QQQ Daily Chart

Tech ETF

If there is one thing to consider is that the Technology Select Sector SPDR® Fund (NYSE:XLK) has formed a bump and run pattern, and that is usually a bearish reversal pattern, and with an RSI of almost 84, a pullback to $118 seems quickly done.
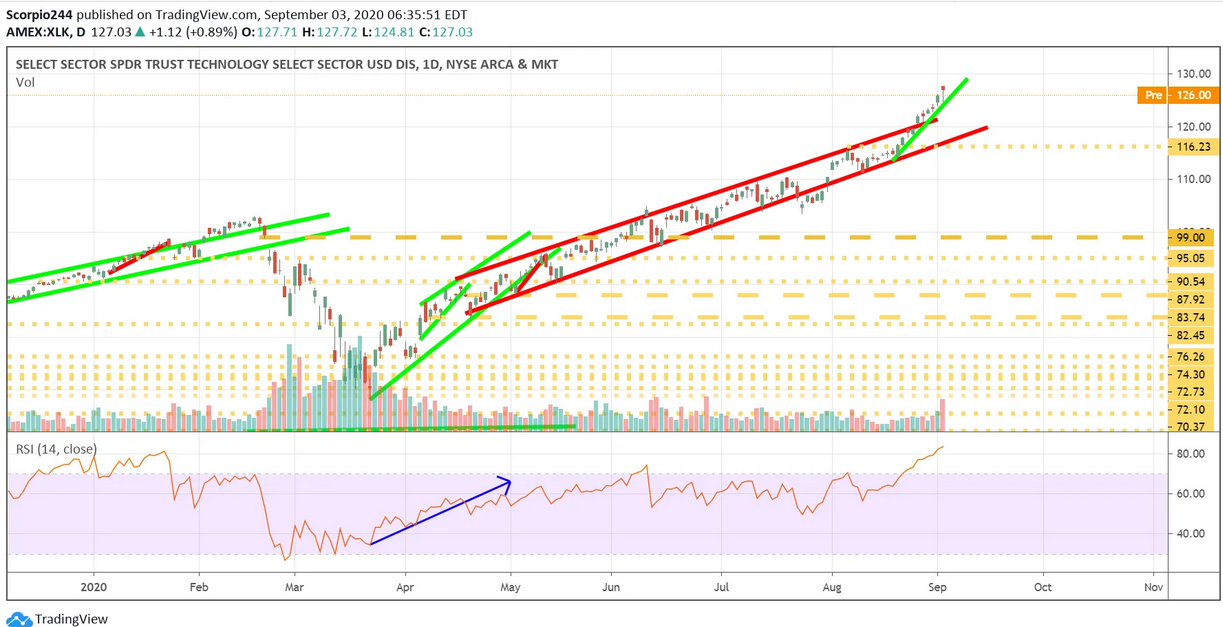
XLK Daily Chart

Dollar

The dollar may continue to catch a bid, especially if the ECB is intent on focusing on the euro. That is terrible news for risk-assets and gold. The significant level to watch is 93.50.
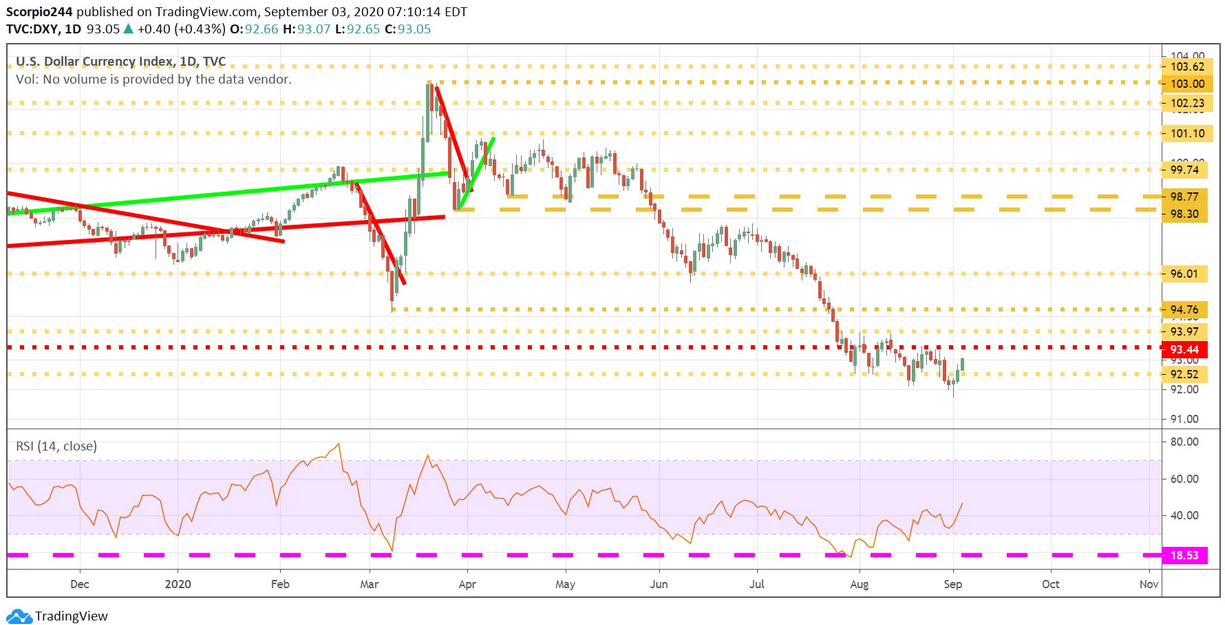
DXY Daily Chart

Gold

Watch for a break of support at $1925 on gold, sending it to $1865. Support as been strong, but the longer it test support, the more likely it is to break it.
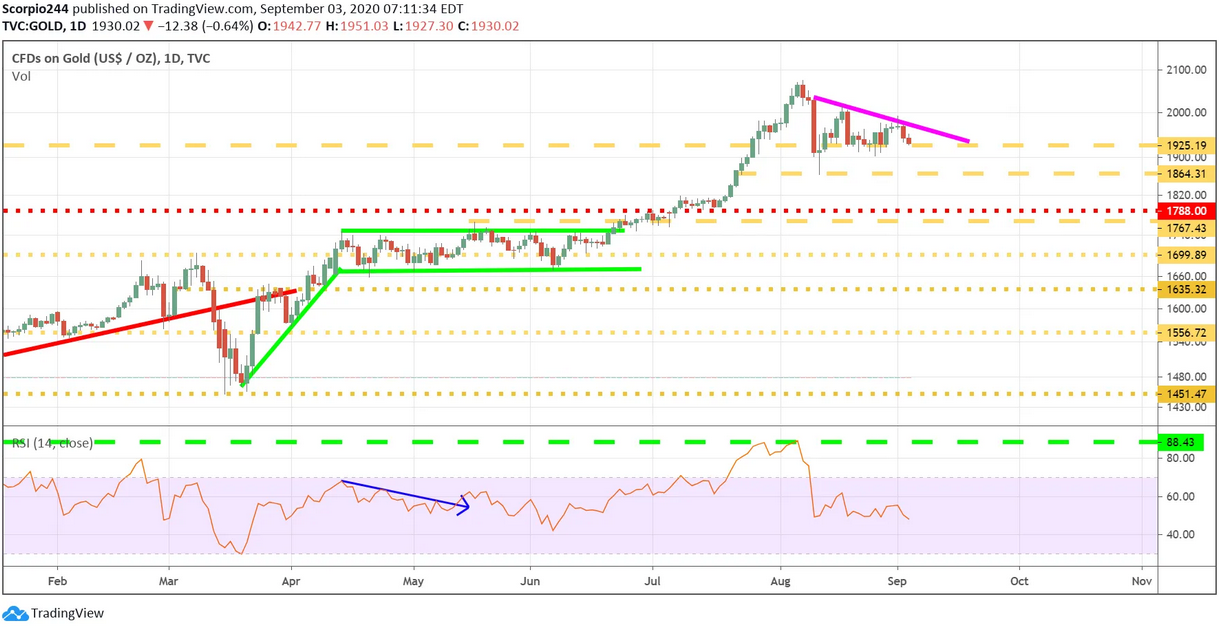
CFDs On Gold Daily Chart

Tesla

Tesla (NASDAQ:TSLA) shares are trading lower today by about 6% to $420. The stock has started to come under pressure since announcing it intents to sell up to $5 billion in stock. It is a smart move, why not especially given how much the stock has run-up. The stock did break critical support yesterday at $442, and $390 is next. I did end up reducing my holdings again in the stock, back to 10%.
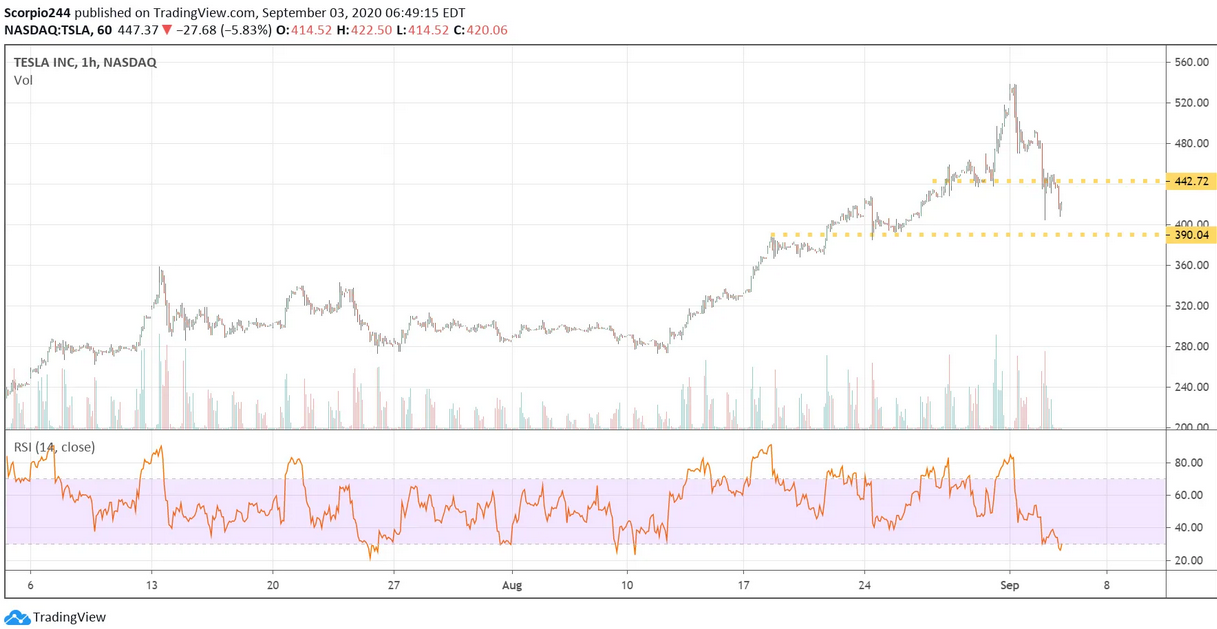
Tesla Inc Chart

Apple

Apple (NASDAQ:AAPL) is also trading down some today, but support looks pretty firm around $124. A break of $124 sends the stock lower to around $115.
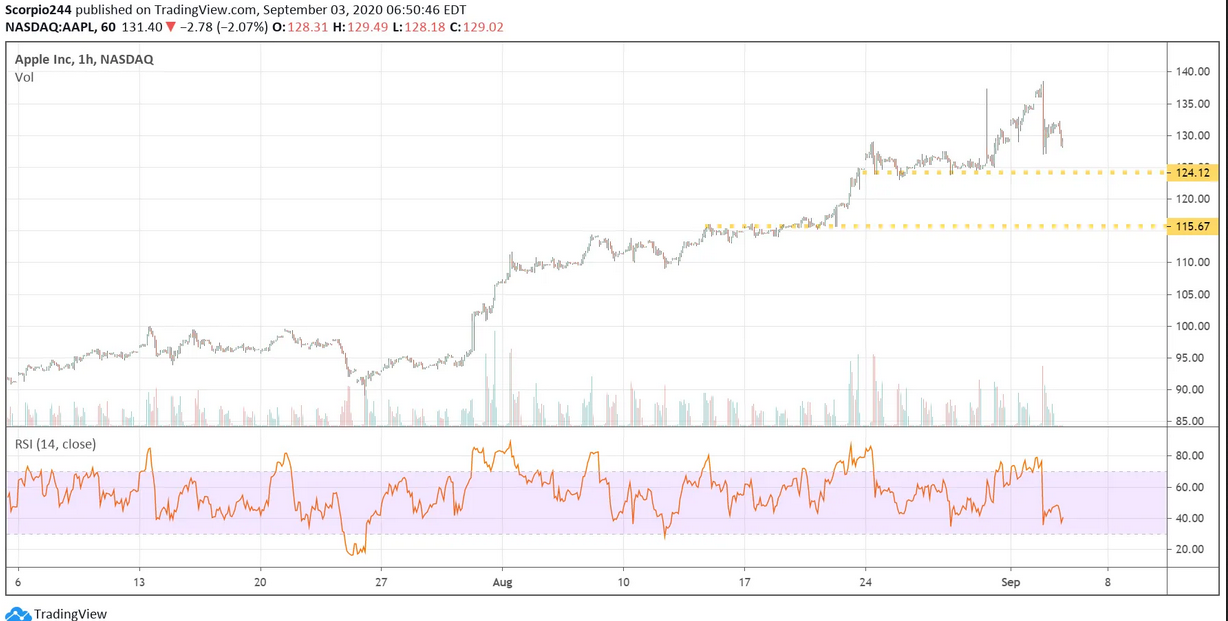
Apple Inc Chart

Adobe

Adobe (NASDAQ:ADBE) has been another big winner in this technology rally and should find some strong support around $510 if a pullback develops.
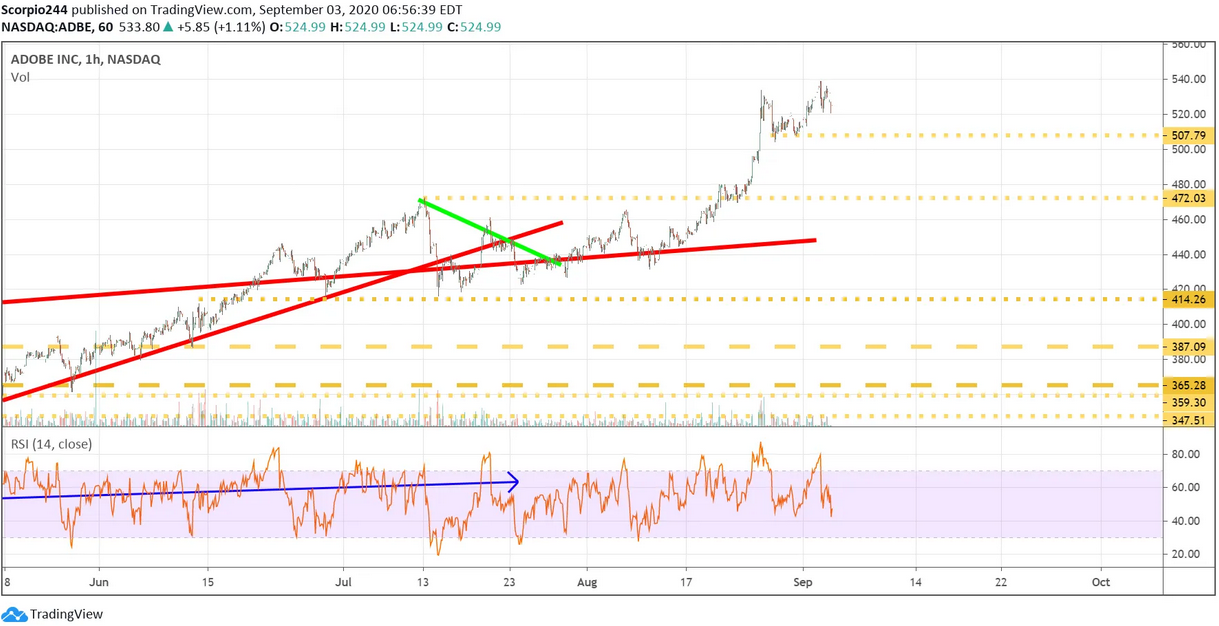
Adobe Inc Chart

Shopify

Keep an eye on Shopify (NYSE:SHOP) for a potential head and shoulders pattern, with a break below $910 presenting long-term issues.
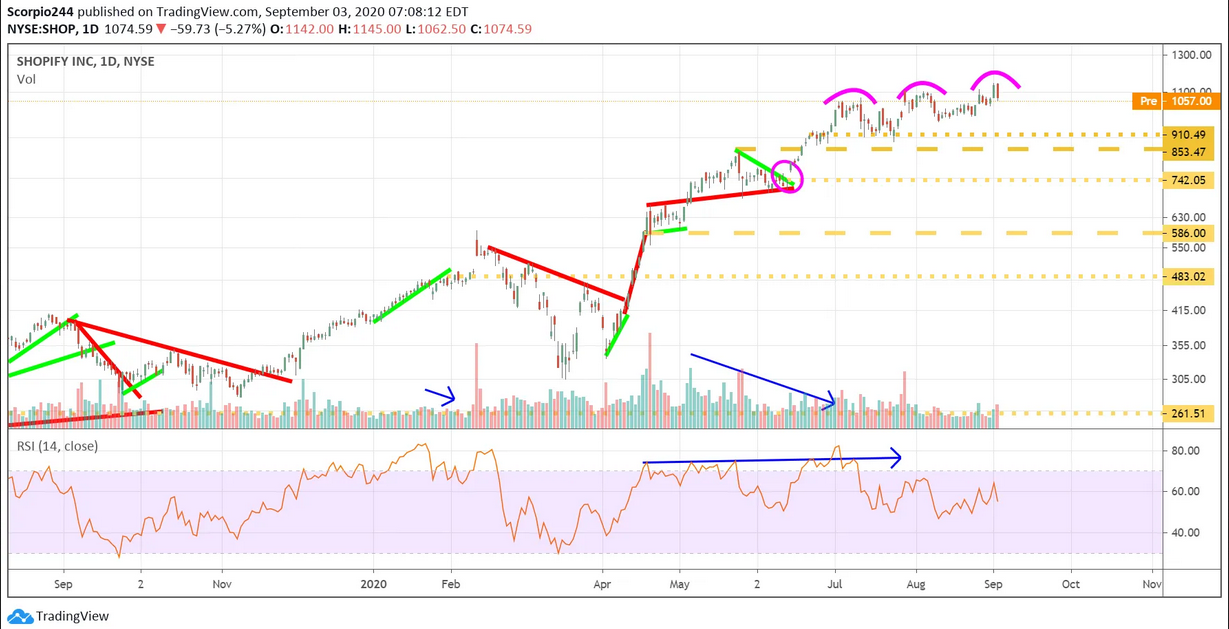
Shopify Inc Daily Chart

Original Post

Latest comments

Loading next article…
Risk Disclosure: Trading in financial instruments and/or cryptocurrencies involves high risks including the risk of losing some, or all, of your investment amount, and may not be suitable for all investors. Prices of cryptocurrencies are extremely volatile and may be affected by external factors such as financial, regulatory or political events. Trading on margin increases the financial risks.
Before deciding to trade in financial instrument or cryptocurrencies you should be fully informed of the risks and costs associated with trading the financial markets, carefully consider your investment objectives, level of experience, and risk appetite, and seek professional advice where needed.
Fusion Media would like to remind you that the data contained in this website is not necessarily real-time nor accurate. The data and prices on the website are not necessarily provided by any market or exchange, but may be provided by market makers, and so prices may not be accurate and may differ from the actual price at any given market, meaning prices are indicative and not appropriate for trading purposes. Fusion Media and any provider of the data contained in this website will not accept liability for any loss or damage as a result of your trading, or your reliance on the information contained within this website.
It is prohibited to use, store, reproduce, display, modify, transmit or distribute the data contained in this website without the explicit prior written permission of Fusion Media and/or the data provider. All intellectual property rights are reserved by the providers and/or the exchange providing the data contained in this website.
Fusion Media may be compensated by the advertisers that appear on the website, based on your interaction with the advertisements or advertisers.
© 2007-2025 - Fusion Media Limited. All Rights Reserved.