Intermediate Vs. Long Term
With concerns related to next week’s election and the strong possibility of a December rate hike, the stock market’s intermediate-term profile has shown some significant deterioration in recent weeks. From MarketWatch:
U.S. stocks ended a volatile session with modest losses on Friday, pressured by the surprise announcement that the Federal Bureau of Investigation was restarting a probe into Hillary Clinton’s emails, adding a new dose of political uncertainty into the market.Major indexes had traded higher earlier in the session, supported by a strong GDP reading, but the news prompted a turnaround and extended the week-to-date declines of the S&P 500 and Nasdaq. However, indexes also ended well off their lows of the session as investors digested the news and its potential implications for the coming election.
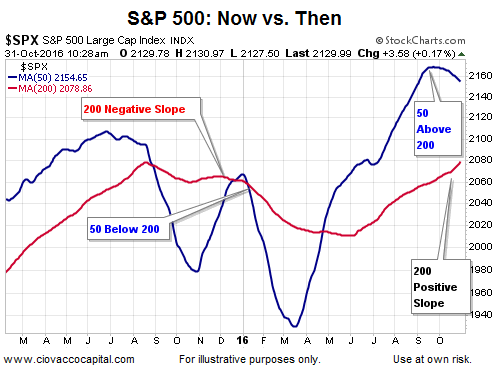
In the S&P 500 chart below, the 50-day moving average (blue) helps us monitor the health of the intermediate-term trend; the 200-day moving average (red) assists with the market’s long-term trend. The 50-day recently rolled over, which is indicative of waning intermediate-term momentum. Currently, the slope of the 200-day looks quite a bit better than it did before the 2016 New Year’s plunge, telling us the present day long-term outlook is quite a bit better than it was on January 1, 2016.

Possible Buying Opportunity
Given current valuations and the relatively disappointing state of global growth, it is easy to understand the long-term bearish case. Is there any long-term evidence that can help us keep an open mind about better than expected long-term outcomes? The answer can be found in this week’s video.
From a fundamental perspective, a recent MarketWatch headline, “Residential Building Can’t Keep Pace With Seattle’s Surging Job Market”, seems incongruent with the end of the world is around the corner theory. From the article:
Seattle’s growth isn’t a new story, but defining its size and impact is often difficult. Companies are often tight-lipped about hiring numbers. Based on multiple reports, though, just four local companies are planning on hiring an additional 10,000 employees in the coming year. There’s phenomenal job growth throughout the region across dozens of large organizations, but by simply focusing on Amazon, Alphabet, Facebook), and Microsoft (NASDAQ:MSFT), the region needs to build an additional 10,000 housing units within a reasonable commute distance to keep our housing situation from becoming more constricted.
A Four-Month Comparison
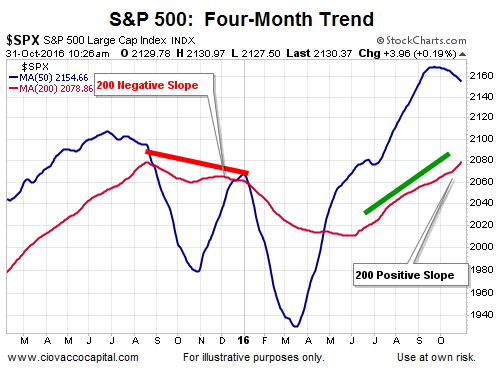
In the chart below, notice how the S&P 500’s 200-day moving average had been falling for four months prior to the ugly stock market plunge in January 2016 (see slope of thick red line). Compare and contrast the last four months of 2015 to the last four months in 2016 (slope of red thick line vs. slope of green thick line). The market’s risk profile, from a long-term perspective, looks better today relative to late 2015/early 2016.

The present day look of the 200-day does not eliminate concerns related to waning intermediate-term momentum (looking out several weeks). Sharp declines can occur within the context of a rising long-term trend.
Summary
Until some observable improvement occurs, the market is susceptible to further downside in the coming weeks. If the S&P 500 can recapture and hold above its 50-day moving average (2,155), it would help reduce some of the short-term pressure.
If the market’s long-term trend remains intact, any short-term pullback may represent a buying opportunity, which means it is prudent to maintain a high degree of flexibility. Two anecdotal examples of a “buying opportunity” pullback are August 2015 and the recent Brexit sell-off in June of this year; both periods required a high degree of bull/bear flexibility.

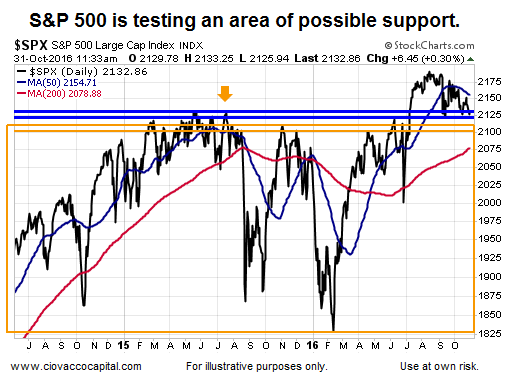
If the market’s long-term trend starts to deteriorate, which is possible, the buying opportunity component would be negated from a probability perspective. As shown in the chart above, the S&P 500 has a band of possible support between 2,134 (2015 high) and 2,100 (area of prior resistance). Time will tell.
