Summary: The S&P index is making new highs. The trend is higher. But in the process, the trading range has become very tight. In the past, this has been followed by higher volatility and limited, near-term upside for equities.
Over the past five weeks, the trading range for the SPX has contracted dramatically. Just 18 points separates the last 5 weeks’ closes (2118, 2108, 2116, 2123, 2126). 4 of these 5 closes are separated by less than 0.5%.
Moreover, the range between the weekly open and close for SPX the last 4 weeks has been 11 points, 6 points, 7 points and 5 points. That averages to a mere 0.3% open/close range each week.
Periods of contraction in the market are typically followed by expansion during which volatility increases. Presented below are several studies that suggest this is likely over the next week or two.
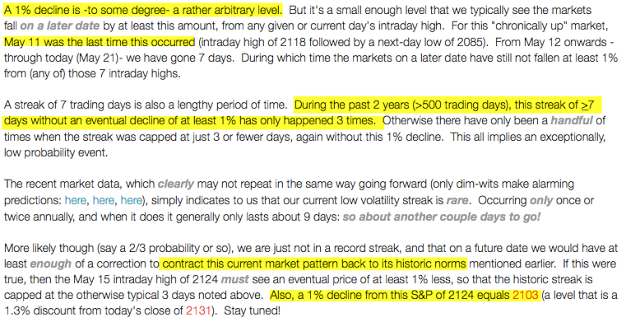
First, Salil Mehta of Georgetown notes that SPX has gone 8 days without a 1% intraday decline from a high. Streaks this long are rare and typically end after 9 days, meaning that a 1% decline is due next week. This implies an intraday visit to roughly the 2100 level is ahead (his post is here).

Second, Sentimentrader measures "VIX sentiment" through a mix of the skew, open interest, volatility and term structure of VIX. This past Thursday, VIX sentiment hit an extreme from which VIX typically rises: after similar instances since 2009, VIX was higher two weeks later 6 of 7 times by an average of 19%. SPX, which usually moves opposite to VIX, closed lower after either the first or the second week 6 of 7 times. SPX also closed lower one month later 6 of 7 times by a median of 2.1% (his report is here).
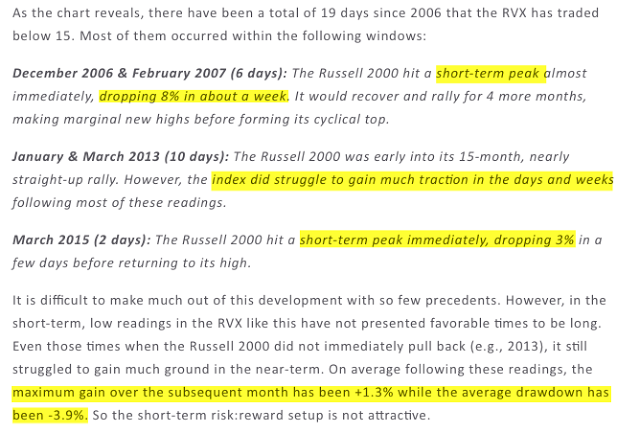
Third, Dana Lyons notes that the volatility index for the Russell 2000, (RVX) hit an historic low on Friday that has only been previously reached on 19 other days in the past 10 years. Often, the stock index declined by several percent thereafter. At best the index struggled to move higher (his post is here).

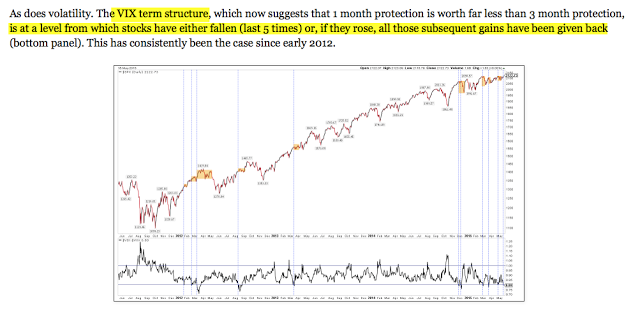
Finally, last week we presented two studies suggesting volatility would soon become a headwind for equities (our post is here). First, the VIX term structure reached a level from which stocks have usually fallen. If equities instead rose, all those subsequent gains would be given back in the weeks ahead (a bigger chart here).

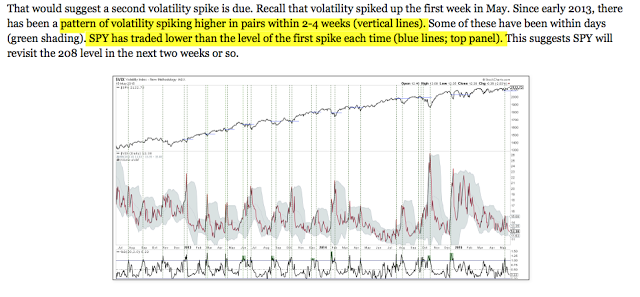
Second, since early 2013, spikes in volatility have come in pairs. The first spike was in early May, implying a second spike is probable by early June (bigger chart here).
The S&P index is making new highs. The trend is higher. But in the process, the trading range has become very tight. In the past, this has been followed by higher volatility and limited near-term upside for equities.
