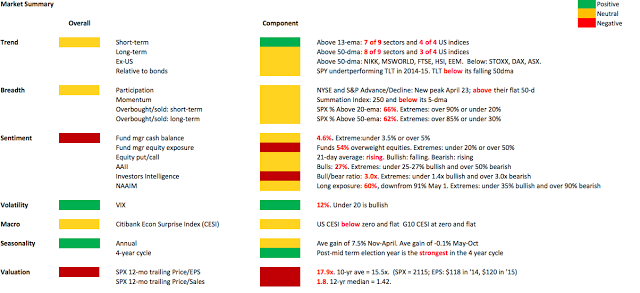
Summary: US indices are in an uptrend. But what they have lacked is the ability to sustain upward momentum for more than a week or two. With the SPDR S&P 500 (ARCA:SPY) at a new ATH, another test of strength has again arrived. There's room for price to move higher, but we suspect that any gains are likely to be short lived
SPY made a new closing high this week; the other indices did not. For the week, SPY gained 0.4% while NDX and RUT both gained 0.8%.
Overseas markets, which had been leading the US until mid-April, are now well off their highs. European indices closed 1% lower this week. Emerging markets gained 0.6%.
Crude oil has been up 8 of the last 9 weeks, but the gains the past two weeks have been minor. The trend higher has taken a pause.
Looking ahead, the main question once again is whether the breakout to new highs in SPY will hold. Over the past several months, they have not.
In short, we are back at the point where momentum has failed to carry the indices higher. Since the week of February 17, three months ago, NDX has not been able to gain even two weeks in a row. SPY has not been able to gain more than two weeks in a row. Both have a chance to change that pattern in the coming week.
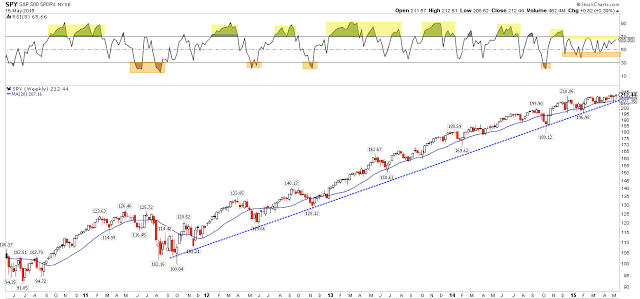
The absence of follow-through is most clearly seen on the weekly SPY chart. The trend is clearly higher but momentum has not been strong; in fact, RSI has only been higher once since the week of December 1 (top panel). In other words, momentum has now reached the level at which the SPY has been close to turning lower over the past 5-1/2 months.
The same is largely true on the daily chart. Since December, momentum has reversed at present levels (top panel). The one exception was in late February, but those gains were quickly given back. In fact, each new "breakout" to a new high since September 2014 has quickly failed (yellow shading).
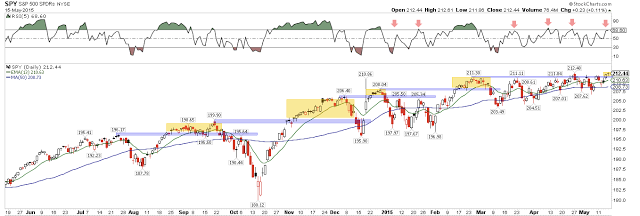
That said, the trend even on the daily chart is higher. Note that each of the lows since February have been higher than the previous one. That is the definition of an uptrend.
There has been a slight change in investor sentiment, and we mean slight. The Investors Intelligence bull/bear ratio dropped to 3.0x this week (bottom panel). That means there are 3 times as many bulls as bears. You would think that was contrarian bearish for stocks, and prior to 2014 you would be right (red shading). But since then, 3.0x has been close to a floor from which stocks rose (yellow shading).
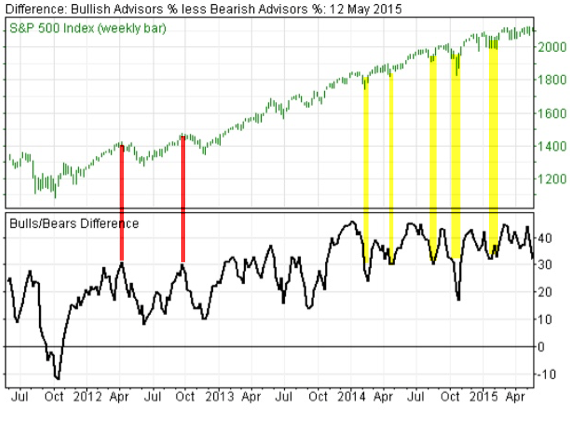
That seems like a fairly meager advantage for equities to appreciate upon. It wouldn't take much of an advance before sentiment tilted decidedly bearish once again.
Many commented on the low number of AAII bulls this week. At 27%, it is right where it was in mid-March. SPY traded lower over the next month. Why? Because there are also few bears (26%). Essentially, individual investors are just neutral. There is no edge in this data.
Should equities rise further, we think the gains will continue to be short lived. Sentiment and the pattern of failed breakouts suggest this will be the case.
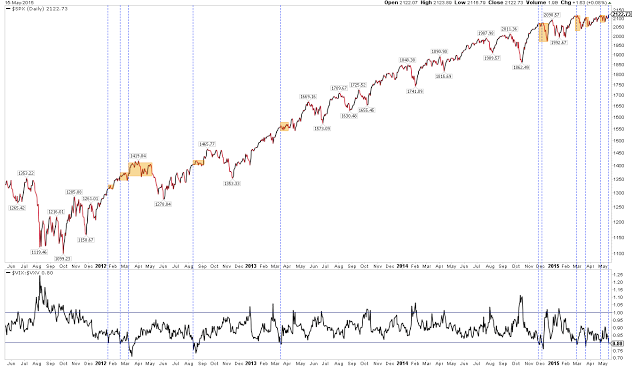
As does volatility. The VIX term structure, which now suggests that 1 month protection is worth far less than 3 month protection, is at a level from which stocks have either fallen (last 5 times) or, if they rose, all those subsequent gains have been given back (bottom panel). This has consistently been the case since early 2012.
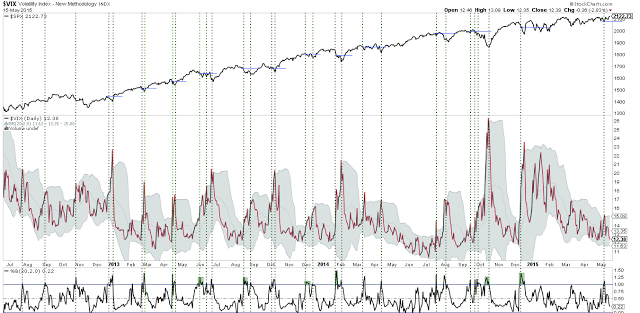
That would suggest a second volatility spike is due. Recall that volatility spiked up the first week in May. Since early 2013, there has been a pattern of volatility spiking higher in pairs within 2-4 weeks (vertical lines). Some of these have been within days (green shading). SPY has traded lower than the level of the first spike each time (blue lines; top panel). This suggests SPY will revisit the 208 level in the next two weeks or so.
All of the gains this past week came overnight. SPY gained $0.8 for the week; overnight net gains were $0.9 and cash hours lost $0.1. This is minor but it repeats a pattern from the past four weeks. During this time, SPY has gained $4.5; overnight net gains were $6 and cash hours lost $1.5.
When this pattern has happened in the past year, the market has resolved downward each time (March, July, September and December 2014). Since 2009, gains between cash hours and overnight have been even (hat tip to Jon Boorman; read here).
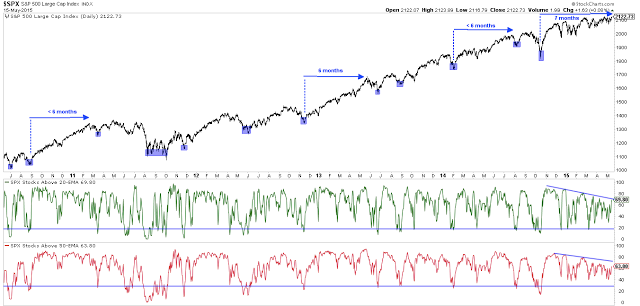
Sentiment and momentum, together with gains only occurring overnight, all suggest that the uptrend is tiring and in need of a washout in breadth. In the past 4 years, those washouts have occurred every 6 months or less. It has now been 7 months since breadth has washed out (lower panel). From 2004-07, the only longer stretch was 8 months (ending in February 2007); in the next month, SPY dropped 7%.
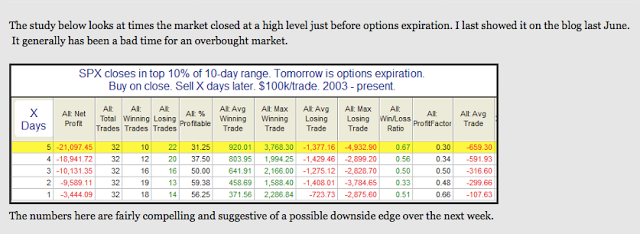
Most of the gains this past week came the day before Options Expiration. SPY gained more than 1% Thursday. Strong gains ahead of OpX are very often followed by poor returns in the next week (chart from Rob Hanna).
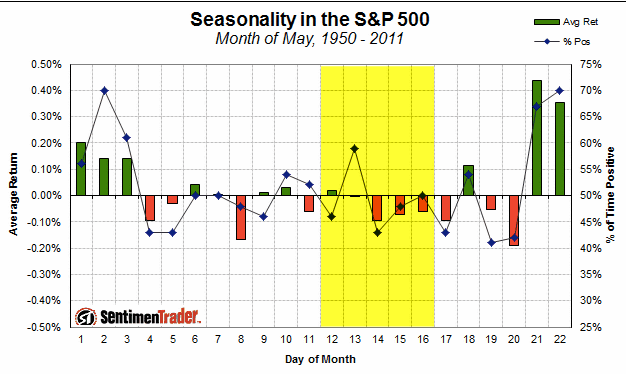
Mid-May also has a weak seasonal tendency. The coming week is highlighted in yellow (data from Sentimentrader).
SPY has been in a rising channel for the past two months. On strength this coming week, the top of the channel meets weekly R1 at 213.8 (red line). This is the first level of resistance. The bottom of the channel, on weakness, is near weekly S2 (green line); this is also the early May low referenced earlier. The weekly pivot is 211, right at a one week trend line (blue); this is the first level of support to watch. Note the potential weakening in short term momentum (top panel).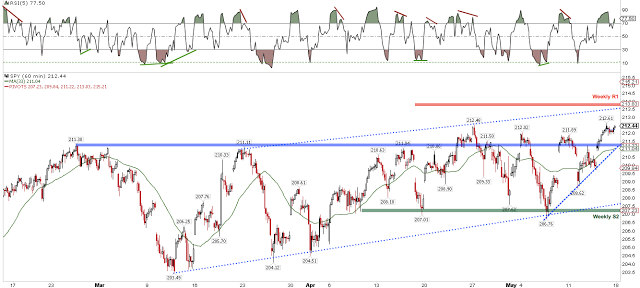
There are few catalysts in the coming week. Earnings season is largely over and there is little on the economic calendar: housing starts on Tuesday, FOMC minutes on Wednesday and CPI on Friday. None of these are likely to show a dramatic change.
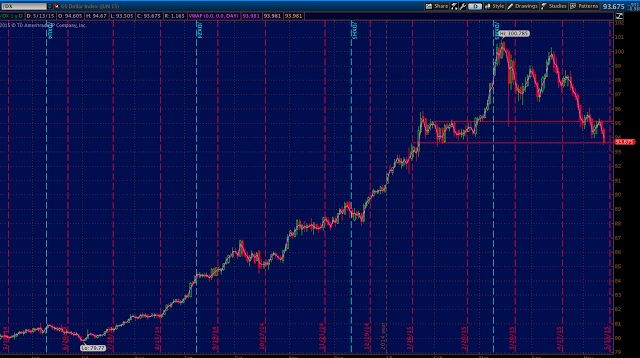
A final point: the dollar has now lost all of its gains since the start of 2015. It is at seemingly critical support level. Recall that 1Q earnings were negatively affected by the dollar's strength. Therefore, should it continue to weaken, this represents a tailwind for earnings in the quarters ahead.
In summary, US indices continue to move higher in an uptrend. But what they have lacked is the ability to sustain upward momentum for more than a week or two. With SPY at a new ATH, another test of strength has again arrived. There's room for price to move higher, but we suspect that any gains are likely to be short lived.
Our weekly summary table follows.
