Listening to the financial media every day, and watching the stock and bond markets trade, there is always an “immediacy” to the news, and it tends to be binary: either great wealth is being created daily and you are “missing out” or the sky is falling and you should worry until your hair falls out.
CNBC, Bloomberg, Fox, they never tell you “no sweat, it’s a secular bull market and you really shouldn’t worry too much about it”. That wouldn’t sell advertising.
Only Warren Buffett gives you that kind of perspective, and I hope Mr. Buffett stays around for a long, long, time.
With all the talk on CNBC yesterday about the March 9th, 2009, “Mark Haines bottom” (some might call it the Doug Kass bottom too since Kass, who writes for Jim Cramer’s TheStreet was saying something similar in late February, early March of 2009). Mark Haines was the talented anchor of the early morning segment at CNBC for years, sometimes with Erin Burnett, sometimes with others.
Haines, Kass and a few others were right with their call. Kass even called it a “secular bottom” which was an important distinction.
The point of the article, or the question I ask today is: “Did this current bull market begin on March 9th, 2009 or in late April, early May of 2013, when the 1,550 – 1575 previous all-time-highs for the S&P 500 were taken out and haven’t been seen since?

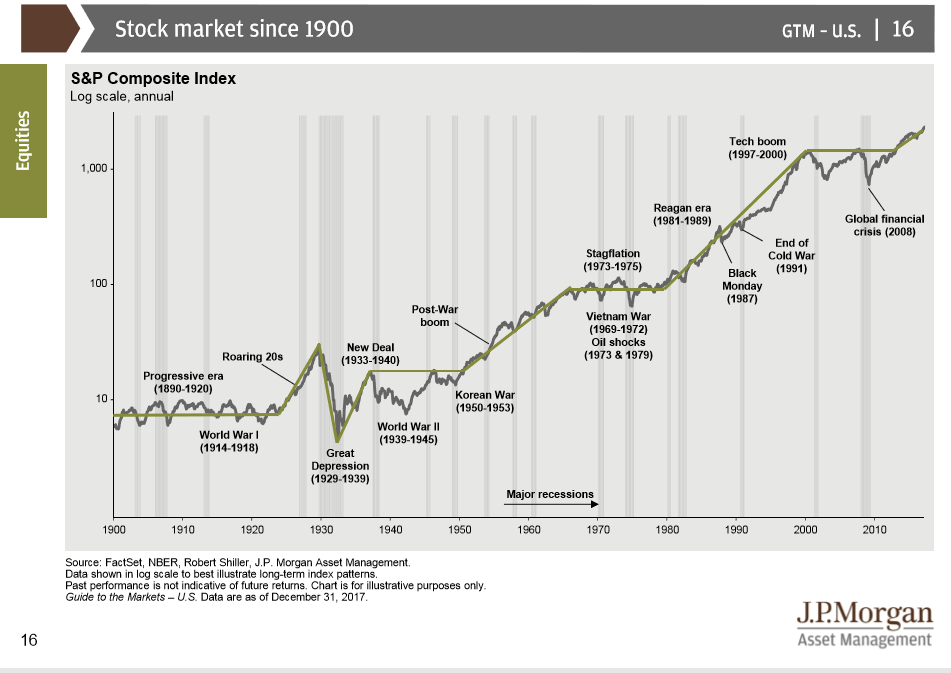
Here is a graph from JP Morgan’s “Guide to the Markets” put together by Dr. David Kelly and the JP Morgan research team and distributed to clients every January 1st, April 1st, July 1st and October 1st.
It shows the S&P 500 since 1900, and includes the Great Depression, the post WW II boom, the 1982 to 2000 bull market, the two bear markets of last decade and then in the upper right-hand corner, the start of the new bull market above the 2000 and 2007 highs.
The point of this is there were many different Presidential, Congressional tax, fiscal and monetary policies, Fed Heads, etc. etc.
Seriously, the key to making money in the stock market is just time invested in the market.
Here is the recent history of the US secular bull markets:
- 1949 to 1966: roughly 17 years
- 1982 to 2000: roughly 18 years
- 2009/2013 till ?
Are we 5 or 9 years into this equity bull market?
My own opinion, is that we are likely in the 4th or 5th inning of the 9-inning ballgame, just to be conservative.
Do you count a 20% correction as a bear market? The risk to the client should be permanent loss of capital, like the Nasdaq falling from 5,000 to 2000, or the S&P 500 hitting 1,575 in October, 2007 and then not regaining that old high for another 6 years.
The discussion then gets into capital gains harvesting, and trading, etc. which is a bigger discussion, but hopefully readers see the point.
It’s a secular bull market, and you could make a good case that valuations are much more reasonable today than the late 1990’s.
The forecast made for 2018 for the S&P 500 and the bond market still stand. The Tech weighting was cut a little too early, but adding to Financials hasn’t hurt in terms of either absolute or relative performance.
I’m sure there will be much weeping and gnashing of teeth.
