Contrary to the DJIA, the NASDAQ (see below) has no peak relative strength values (RSI5) but instead sports negative divergences, has triple negative divergence on the MACD and contrary to the DJIA peak money flow values (MFI14) can coincide with larger declines (red intermediate-iii, green minor-3, grey minute-i.
The Elliot wave count shows that the NAS has completed 5 (green) waves up off the mid-August low, with price getting very close to the ideal 5th wave 2.000x 1 extension target, as on Friday price dropped below the (grey) minute-i of (green) minor-5 level and can thus not be part of the latter wave.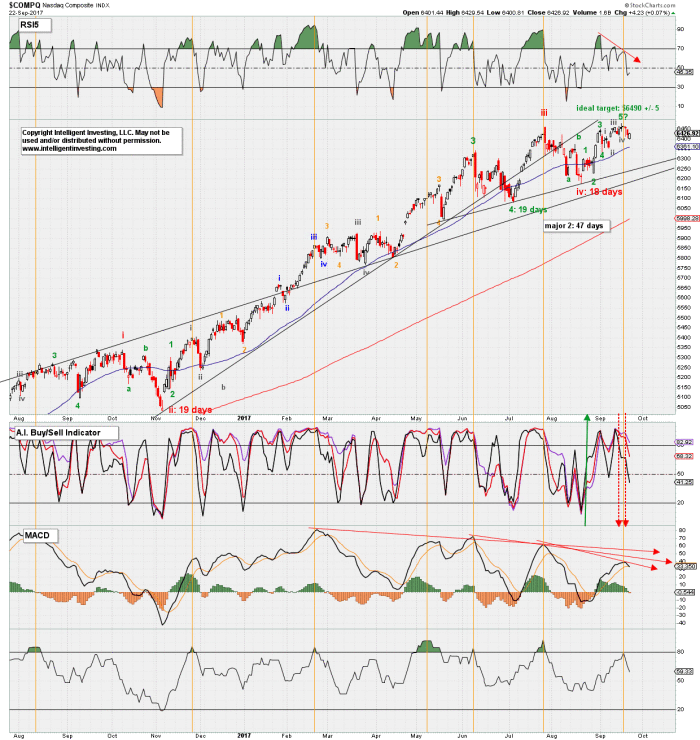
Price now needs to drop below green minor-4 ($6335) and below the mid-August low ($6177) to confirm major-3 peaked. If it fails to do so , and instead rallies higher, intermediate-v is subdividing targeting first $6540-6570. For now, however, the daily chart looks weak and bleak and the TIs want to see lower prices.
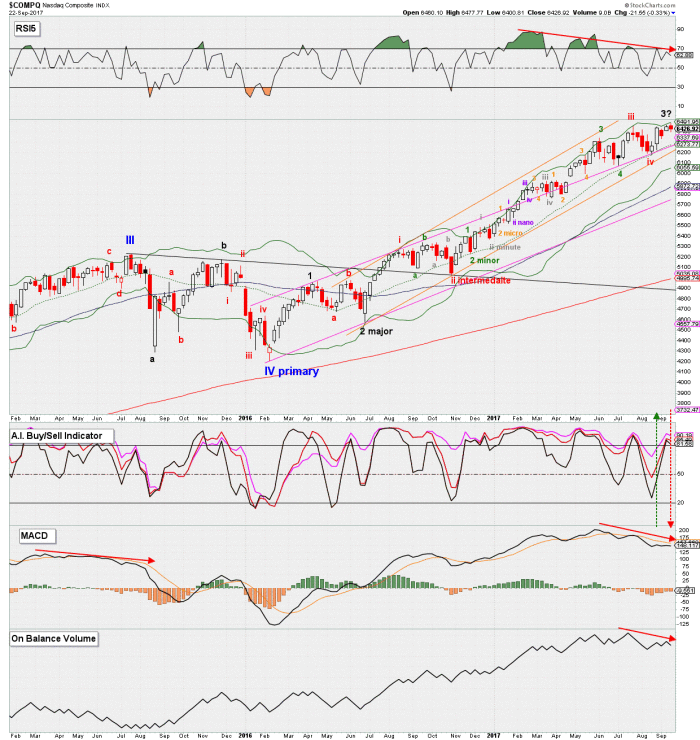
The weekly chart of the NAS also continues to sport negative divergence across the board below. The Elliot Wave count based on weekly candles supports the count from the daily chart. The MACD remains on a sell, whereas the A.I. now gave an initial sell signal as well. The only thing Bulls have going for it is price is above the 20-200w SMAs (longer term uptrend) and above the purple uptrend line, as well as inside the green uptrend channel. Support is now the 20w, and trendlines ($6275ish)
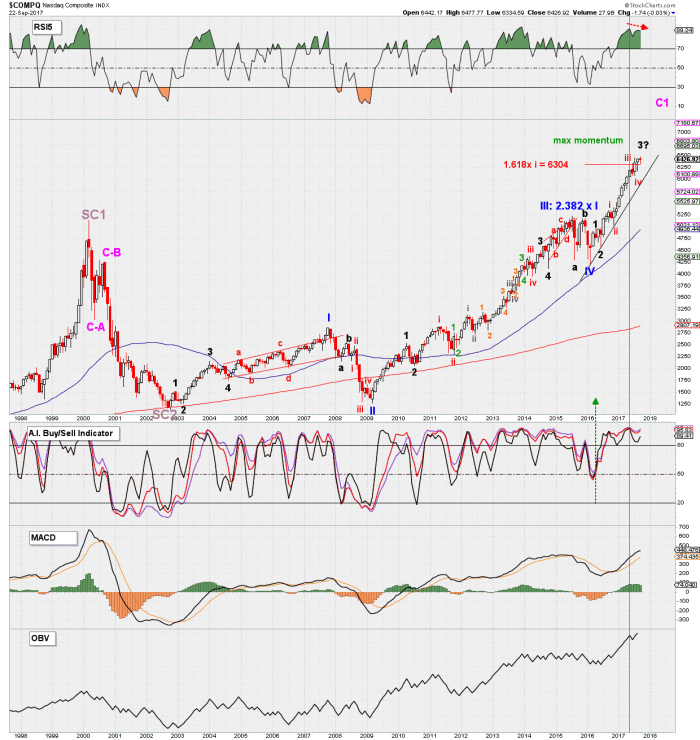
Although the month of September is not over yet, still 1 week left, the monthly charts of the NAS also sport negative divergence on the RSI5. Note that the DJIA has no negative divergence on the RSI5 and has now registered its highest reading since 1985 (not shown). Quite the difference. Divergence is only divergence until it isn’t, but for now it should be noted.
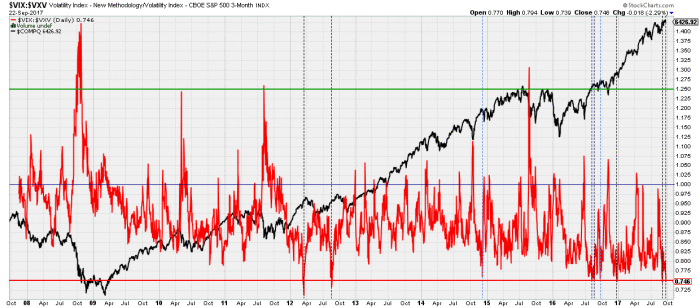
Lastly, most of the indicators I follow, which were discussed at length in this week’s digest– are flashing warning signs. For example, the VIX/VXV ratio I discussed on September 1, see here, dropped below 0.75 again on Friday. What did that mean for the NASDAQ? On September 1 the NAS closed at $6440, four days later it closed at $6361, and this Friday -3 weeks later- it closed at $6427, while only making a marginal higher high ($6380) in between. Indeed not a stellar performance of the NASDAQ.
In addition, although the Bullish Percent Index (BPI) improved off the mid-August low, it continues to sport negative divergence since Q1. This means the higher prices come on the back of fewer and fewer stocks that have Point and Figure (P&F) Buy Signal. To learn more about the BPI and P&F charts, click here). Although this divergence can last for some time, since the current Bull’s start in 2009 prior negative divergences all led to corrections of different magnitudes. This chart fits with the preferred and shown Elliot Wave count.
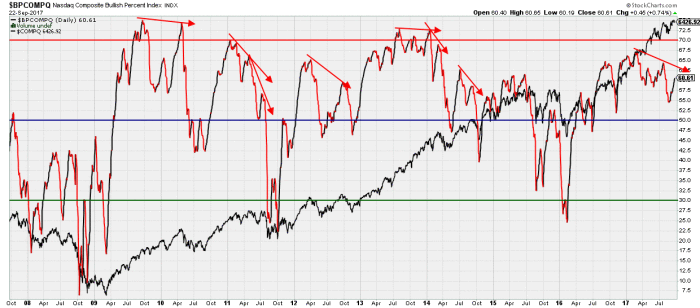
In conclusion, the daily, weekly, and monthly charts of the NASDAQ all show fading momentum on the back of higher prices, which is confirmed by the over time decreasing breadth numbers, while complacency is at historic lows again. Only a stellar performance this week by the index can erase all these negatives, and reset the clock.
