OK, I understand that it not even the 15th of April yet. So yes, talking about a portfolio for the month of May is a tad premature. And sure I would love to claim that I am “ahead of the curve” and “actively proactive” (if you are by chance playing a drinking game at home I believe this would call for two shots). But the sad reality is that if I don’t write about this topic today while I am thinking about it there is a good chance that I will forget to do so before the end of April. Soooooooo……………
(See also JayOnTheMarkets.com: Soybeans, Crude Oil and Gold, Oh My)
The May Portfolio
Here is my suggestion submitted for your approval – or disapproval as the case may be (and please note the use of phrases like “Sure Thing”, “Lead Pipe Cinch”, “You can’t lose trading sector funds” and words like “recommendation”), with 25% going into each fund:
FDFAX – Fidelity Select Consumer Staples
FSHCX – Fidelity Select Health Care Services
FSPHX – Fidelity Select Health Care
FGOVX – Fidelity Government Income Fund
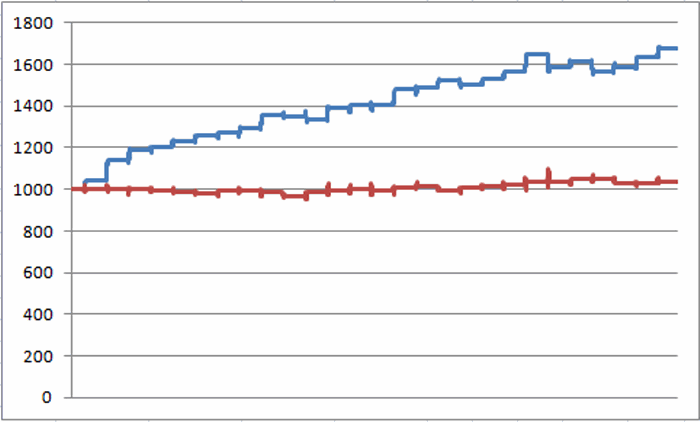
Figure 1 displays the growth of $1,000 invested only in this portfolio and only during the month of May (no interest is added while out of the market) versus $1,000 invested only in ticker VFINX (Vanguard S&P 500 Index Fund).

Figure 1 – Growth of $1,000 invested in Jay’s 4 Fidelity fund portfolio (blue) versus VFINX (red) during the month of May; 1989-2015
As you can see in Figure 1, money invested in the S&P 500 during the month of May for the past 27 years has essentially been “dead money”. The Fidelity portfolio on the other hand has tended to show a steadier rate of growth.
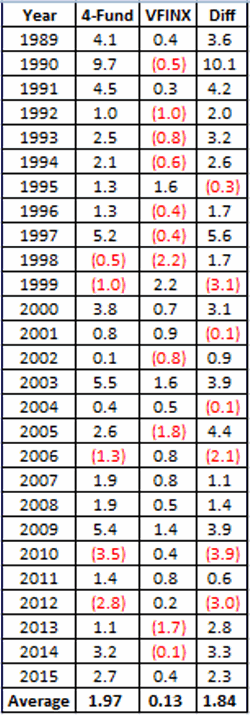
Figure 2 displays the year-by-results and comparisons.

Figure 2 – Year-by-Year Results
A few things to note:
*The Fidelity portfolio average was +1.97%
*The S&P 500 Index fund average was +0.13%
*The Fidelity portfolio showed a gain 22 times (81% of the time)
*The S&P 500 Index fund show a gain 16 times (59% of the time)
*The Fidelity portfolio showed a loss 5 times (19% of the time)
*The S&P 500 Index fund show a gain 11 times (41% of the time)
*The Fidelity portfolio outperformed the S&P 500 Index fund 20 times (74% of the time)
*The Fidelity portfolio underperformed the S&P 500 Index fund 7 times (26% of the time)
Summary
*Is the 4 fund portfolio I listed above sure to make money this year in May? Nope
*Is the 4 fund portfolio I listed above sure to outperform the S&P 500 Index this year in May? Nope
Still, investing is a game of probabilities. Investing in an S&P 500 Index fund during the month of May has generated a gain of +3.4% over the last 27 years.
Not exactly the kind of returns most of us are looking for. Therefore it might make sense to consider some alternatives. Um, like this one.
