I have not been writing a lot lately. The truth is, I'm a little out of sync with the markets these days. And I prefer to write when I feel like I have at least some idea of what the heck is going on.
Soybeans
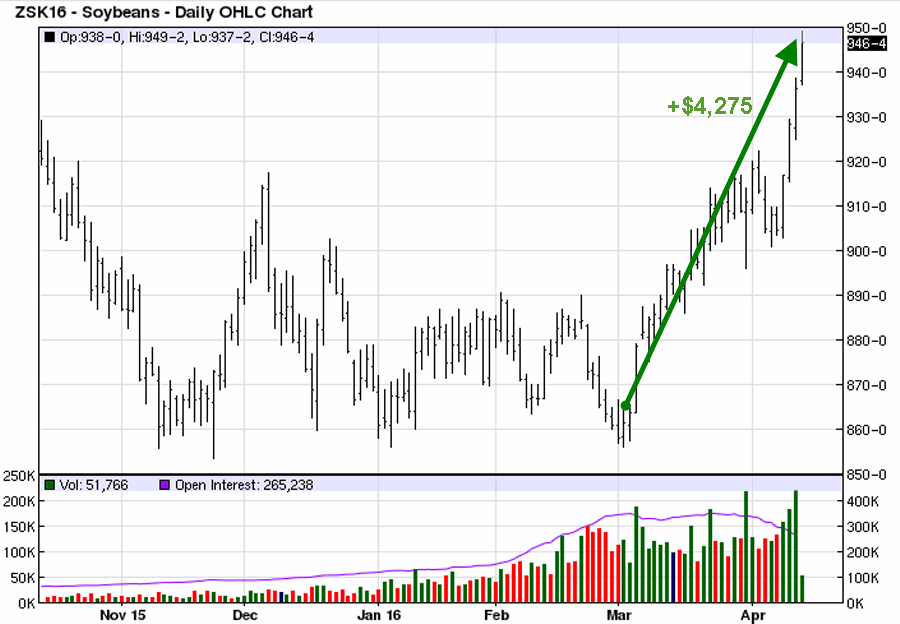
In this article I suggested a bullish position in May soybean futures. Under the category of “One for the Good Guys”, beans have rallied nicely as shown in Figure 1.
Figure 1 Courtesy: www.Barchart.com
At this point a trailing stop – or selling half into strength and using a trailing stop on the remaining position sounds like a good idea. It should also be noted that “First Notice Day” for May soybeans is 4/29. Bottom line, unless you want someone to dump 5,000 bushels of soybeans in your front yard, then you need to exit any and all long positions in May beans before that date. This can involve taking profits, rolling into July or both.
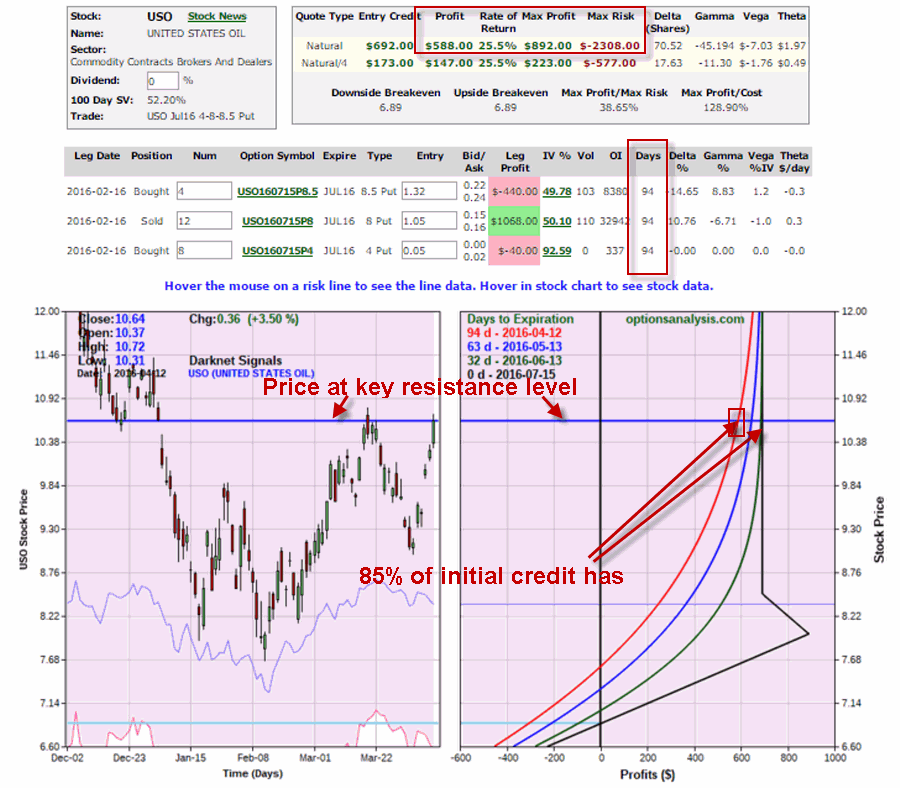
In this article I wrote about entering a somewhat bullish position using put options on United States Oil (NYSE:USO). As you can see in Figure 2, it is “so far so good”. At this point, the trade has captured $588 of the initial $689 credit.
Figure 2 Courtesy www.OptionsAnalysis.com
One position management note: USO is at a key price level as you can also see in Figure 2. If USO fails to break through to the upside, I would consider taking some (or even all) profits and moving on to the next trade, rather than waiting another 3 months in hopes of capturing the remaining profit potential.
Gold
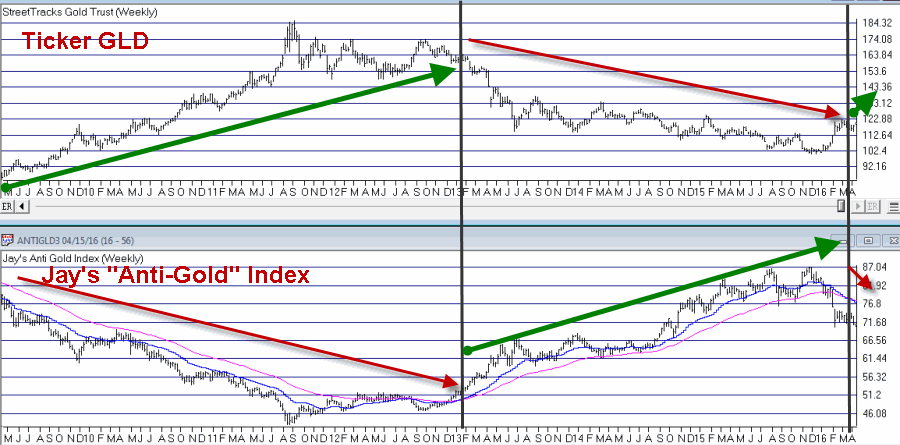
I wrote about a relatively crude moving-average method I use to help identify the trend in gold. As you can see in Figure 3, my “Anti-Gold” index recently flipped back to being “bullish” for gold (by virtue of the fact that the “anti-gold” index flipped to being bearish).
Figure 3 Courtesy AIQ TradingExpert
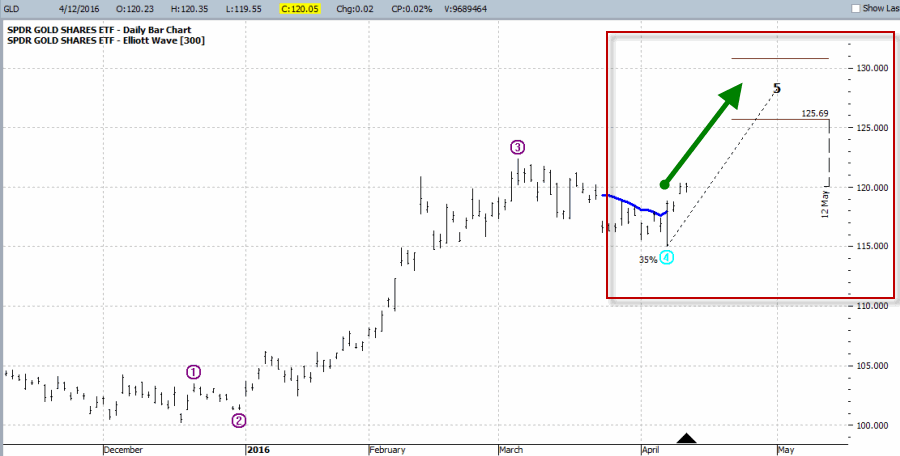
So does this mean it is “clear sailing” for all things gold related? Not at all. All moving-average systems are susceptible to whipsaws. This one is no exception. In the short-term, gold and gold stocks appear to be overbought. Still, as you can see in Figure 4, the Elliott Wave count for (NYSE:GLD) is suggesting the possibility for higher prices in the not-too-distant future.
Figure 4 Courtesy ProfitSource by HUBB


