Often, it pays to sit atop the fray and take the long view.
Even if it means doing so with protective and reflective gear on.
We noted over the weekend that the S&P 500 touched down yet held the 50-DMA, and Semiconductors (NYSE:SMH) landed right on a weekly exponential moving average.
Therefore, as surprising as the rally in equities was yesterday, the bulls have been trained to buy on these key support levels.
The bounce seemingly ignored all the fallout we have yet to assess from the virus and its economic impact.
Yesterday’s rally in the indices and many of the key sector ETFs spawned an inside day.
Furthermore, all the indices and sectors that went into unconfirmed caution phases (SMH, IBB, IWM, KRE, DIA, XRT) stayed there.
Transportation (NYSE:IYT), did at least manage to hold the 200-DMA, so there’s that.

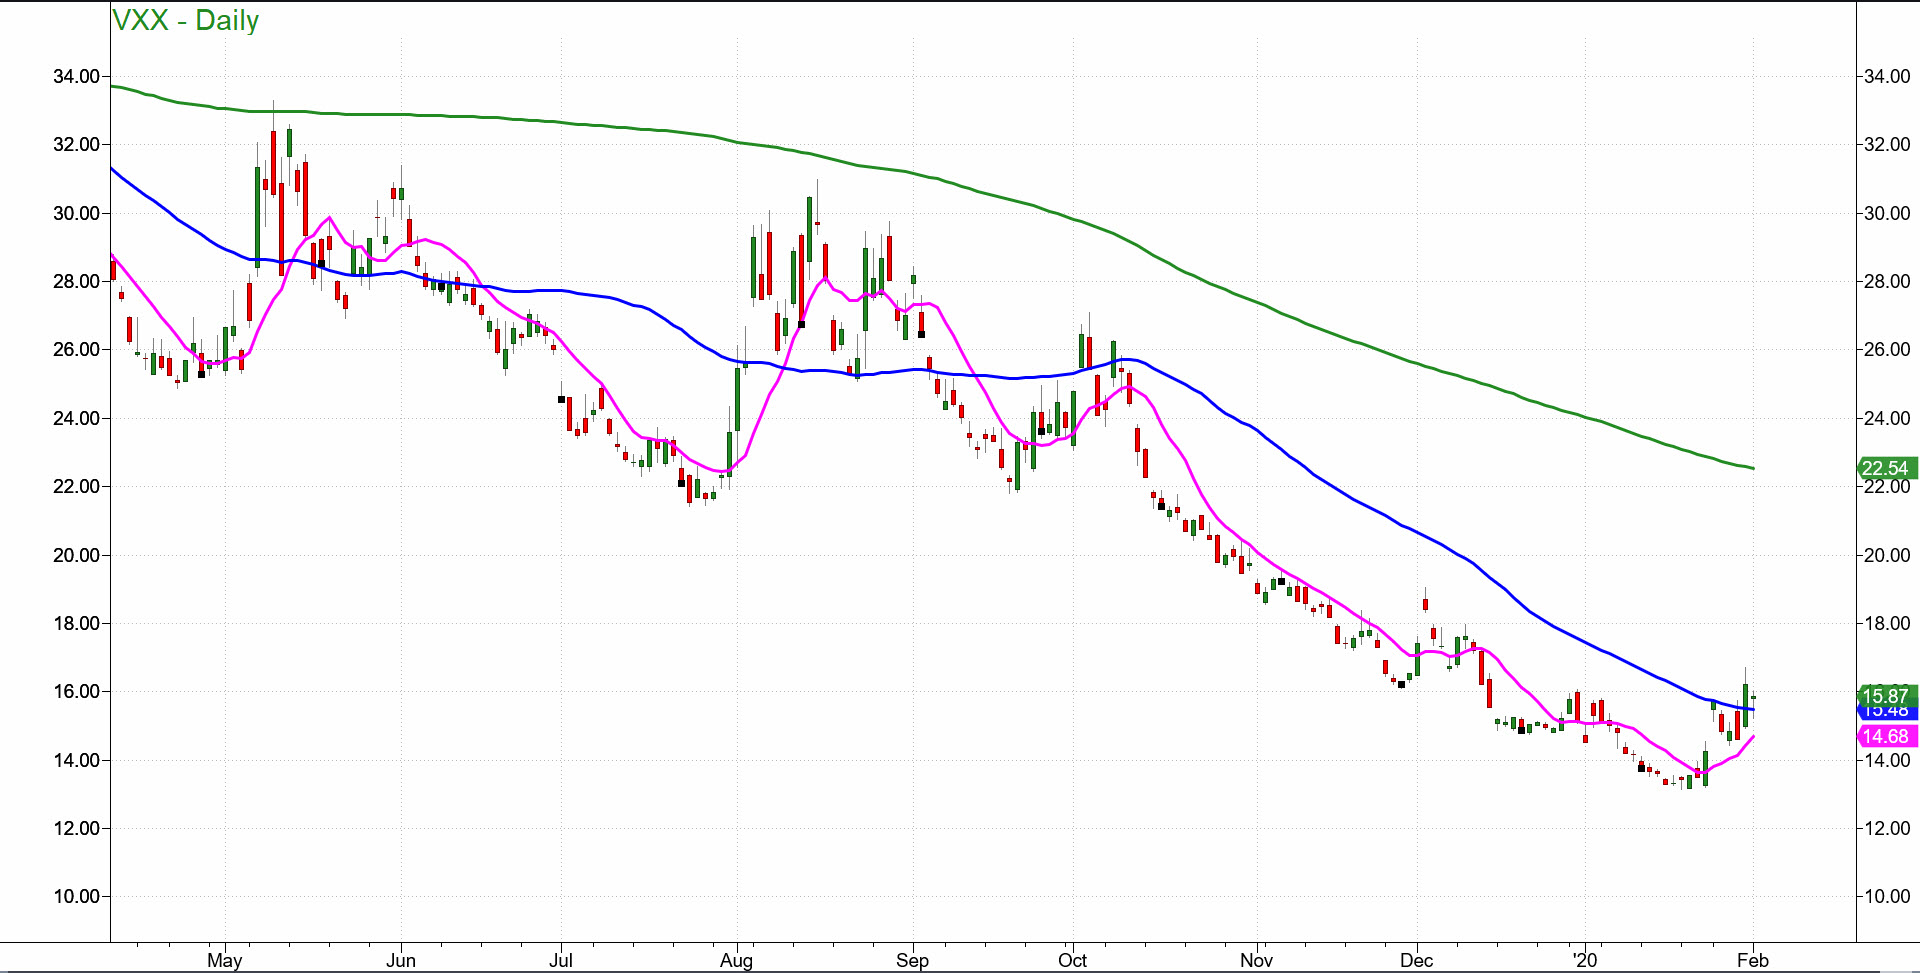
However, with volatility now above its 50-Daily Moving Average and confirmed in a recuperation phase, whether yesterday’s bounce sustains, remains to be seen.
The Daily chart shows three moving averages.
The green above is the 200-DMA, the blue the 50-DMA and the magenta the 10-DMA.
On January 24th, VXX cleared the 10 DMA with 3 times the daily average volume.
Last Friday, VXX cleared the 50-DMA with also close to 3 times the daily average volume.
The seasonal calendar range high is 15.73, now pivotal.
Additionally, VXX had an inside day and confirmed the recuperation phase.
Now, VXX has had pockets of strength last year. Most notably, August 1st, VXX had the most volume in well over a year and rallied $10.00 in less than 2 weeks.
VXX is a great instrument to trade for catching market reversals, but the nature of the instrument can leave swing traders from the long side, poorer.
If I have learned anything from the last four years and the market’s phantasmic irrationality, it’s that deep pockets, mainly from corporate buybacks has helped this market ignore all potentially bad news.
So, watch VXX and also watch how yesterday’s inside day resolves, particularly in the market leaders, Semiconductors and Nasdaq 100.
S&P 500 (SPY) 321 the 50-DMA. 324.00 pivotal and 327.17 point to clear
Russell 2000 (IWM) 160 support 162 pivotal and 164.13 point to clear
Dow (DIA) 284.62 is the 50-DMA pivotal and 287.23 point to clear
Nasdaq (QQQ) 222.10 pivotal 223.56 point to clear
KRE (Regional Banks) 53.90 the 200 WMA and 54.00 is the 200-DMA. Resistance at 55.85
SMH (Semiconductors) 139.97 50-DMA resistance. 136 key support
IYT (Transportation) Unconfirmed caution phase as this sits right on 189.68. Resistance 193.01
IBB (Biotechnology) 111 support 117.40 resistance
XRT (Retail) 43 support at the 200-DMA and must clear 44.23
Volatility Index (VXX) Confirmed Recuperation phase-15.47 pivotal
