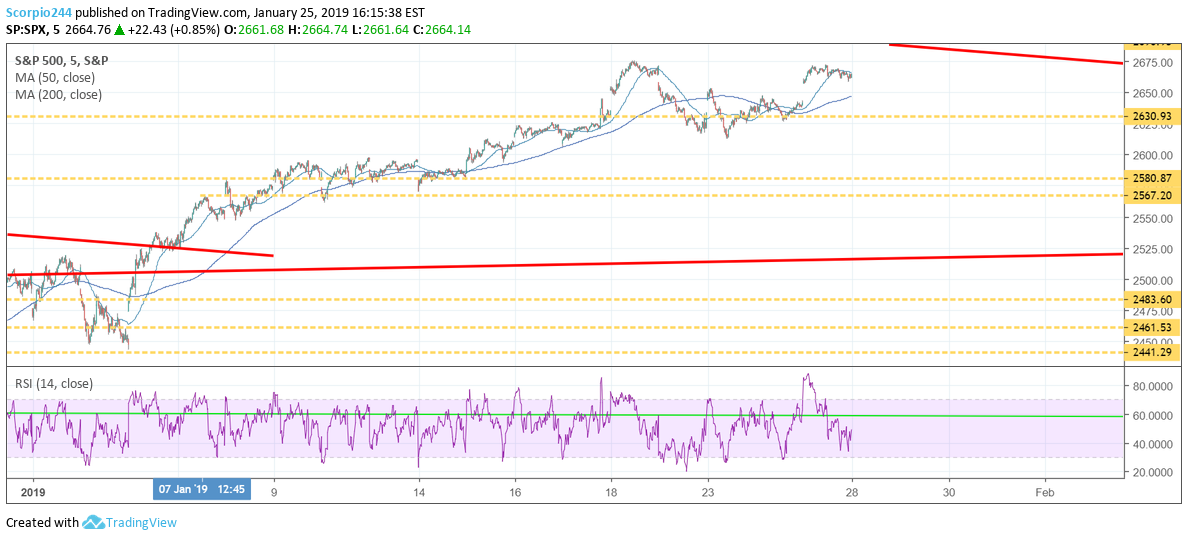
Stocks rallied on January 25 with the S&P 500 rising by over 80 basis points to 2,664. The index continues to work its way higher, recouping the losses from the selloff earlier this week. The rise today, left a pretty big gap in the chart that may be to filled on Monday or early next week around 2,640. Don’t be surprised to see a 1% pullback early next week.
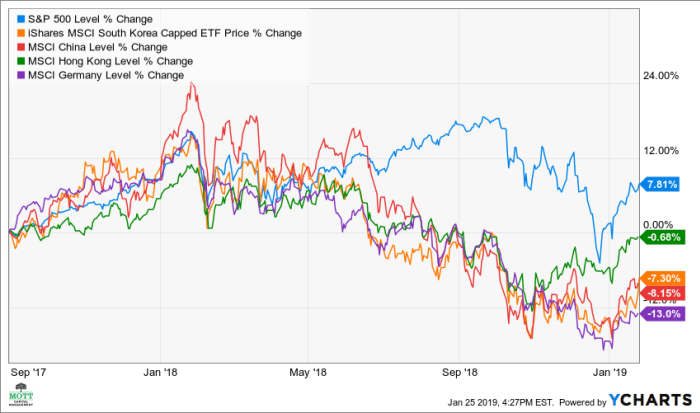
But more important is that it would seem the global rally we noted about a week or so ago is slowly taking hold.
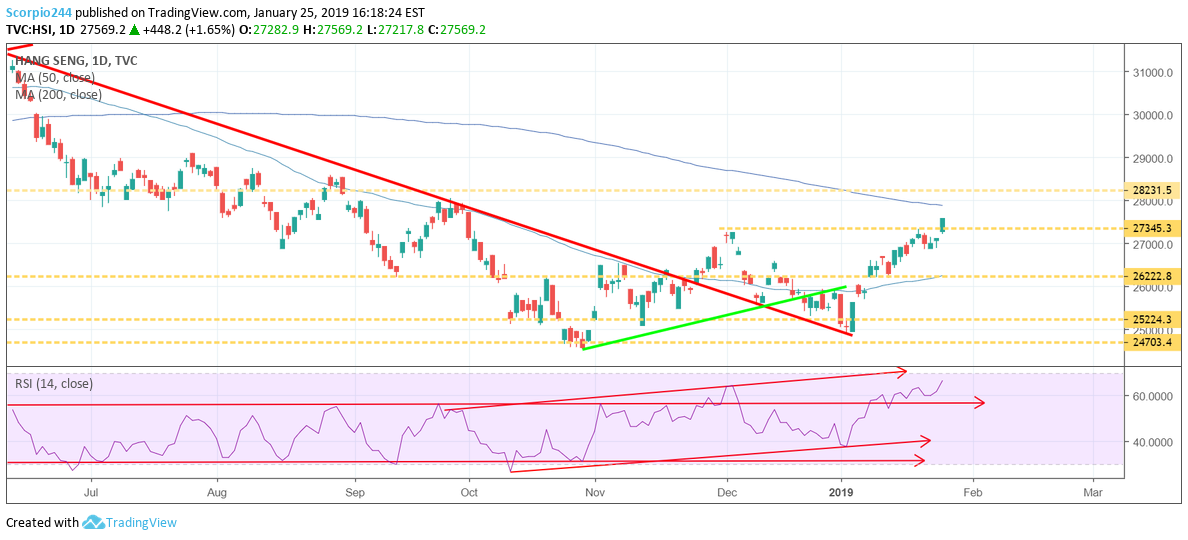
Hong Kong (HSI)
Hong Kong had a big break out last night, as the PBOC continues to try to boost the economy in China. The Hang Seng increased above a critical level of resistance at 27,350, and now it seems to be on pace to rise to 28,200.
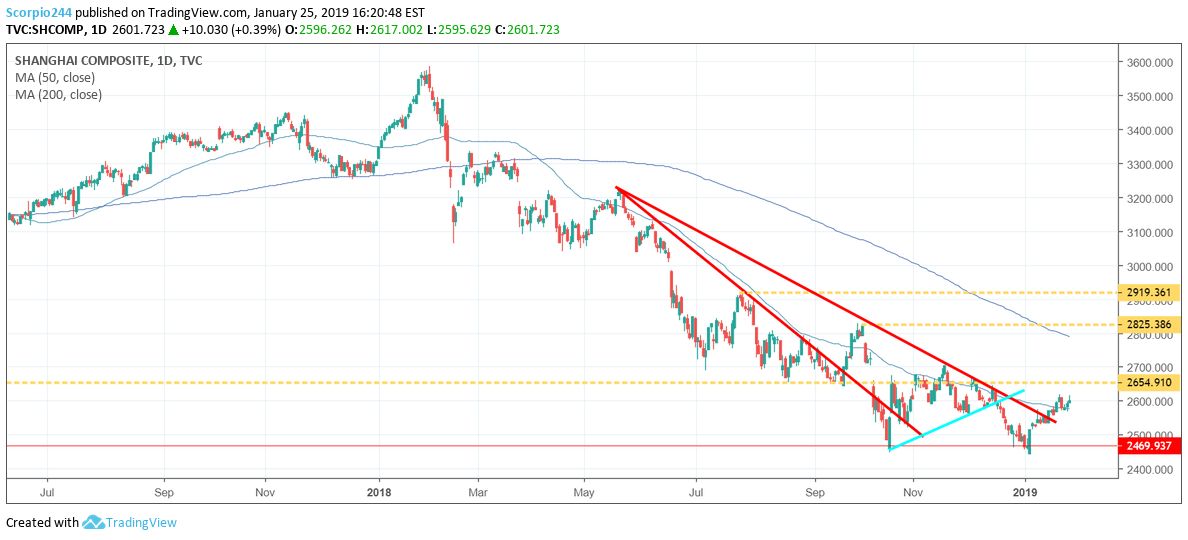
Shanghai
Shanghai Composite is nearing a break out at 2,654.
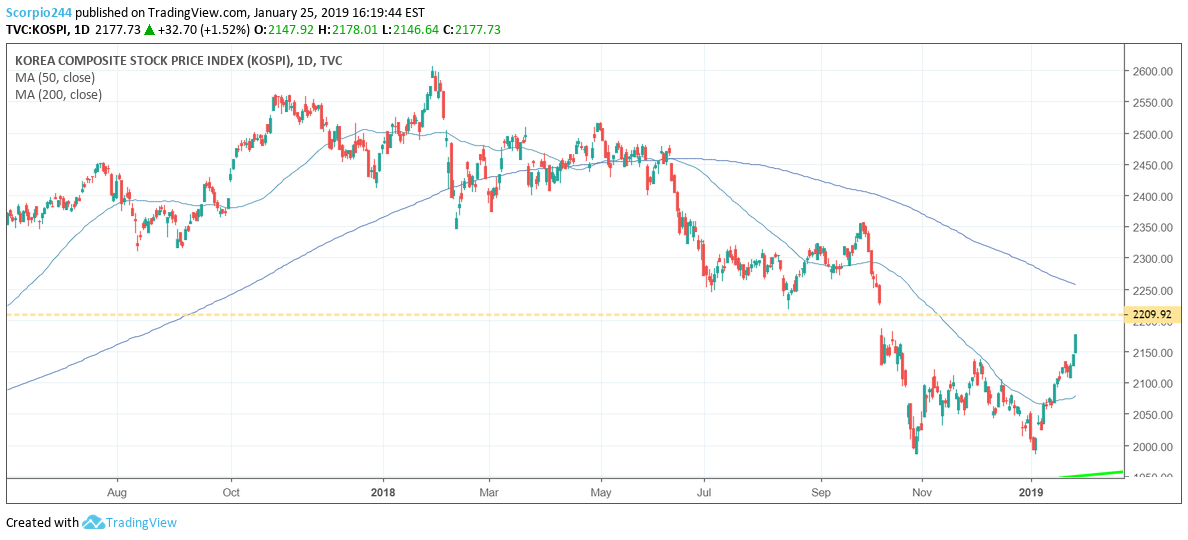
KOSPI
The South Korean Kospi appears to be well on its way to 2,210.
Germany (DAX)
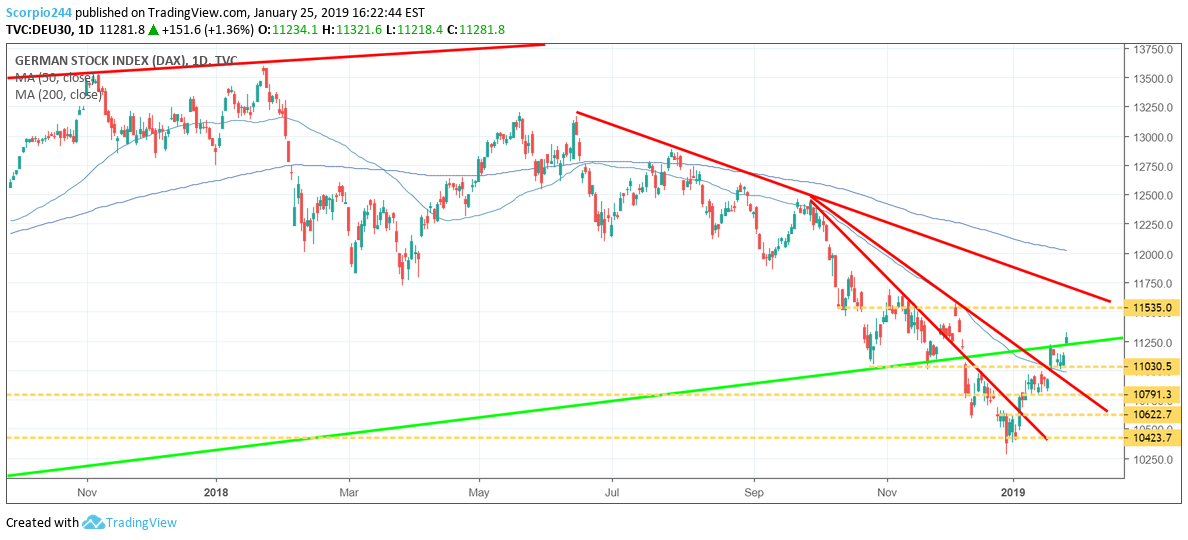
Even the Germany (NASDAQ:DAX) is now back above a long-term downtrend and could be on its way higher.
Again, hard to deny the movements in prices. Now the bigger question –is it a bounce and do we see a reversal once we get to the next levels of resistance? It would be naïve to think it isn’t possible. But remember it was the divergence in equity prices that everyone was pointing to in 2018 as a warning sign. At least to start 2019 the indexes seem to be converging and moving higher together. It would suggest to me that the money is flowing into equities globally, and that suggests a reversal is less likely.
Semis
It is a big positive when even Intel’s disappointing earnings could not cool down the red-hot chip sector. The SOXX EFT and SMH EFT were both up another 2% today, on top of yesterday’s significant gains.
Micron (MU)
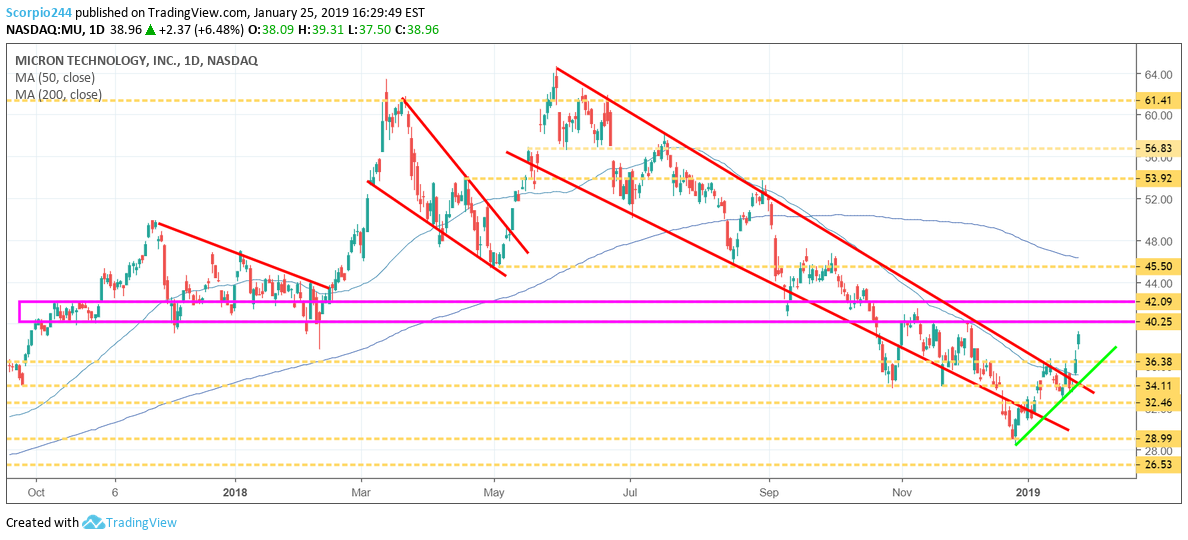
Micron (NASDAQ:MU) continues to be one of the big winners in the group and appears to be heading to that big resistance zone we have watched so closely now for some time around $40 to $42.
Advanced Micro Devices Inc (AMD)
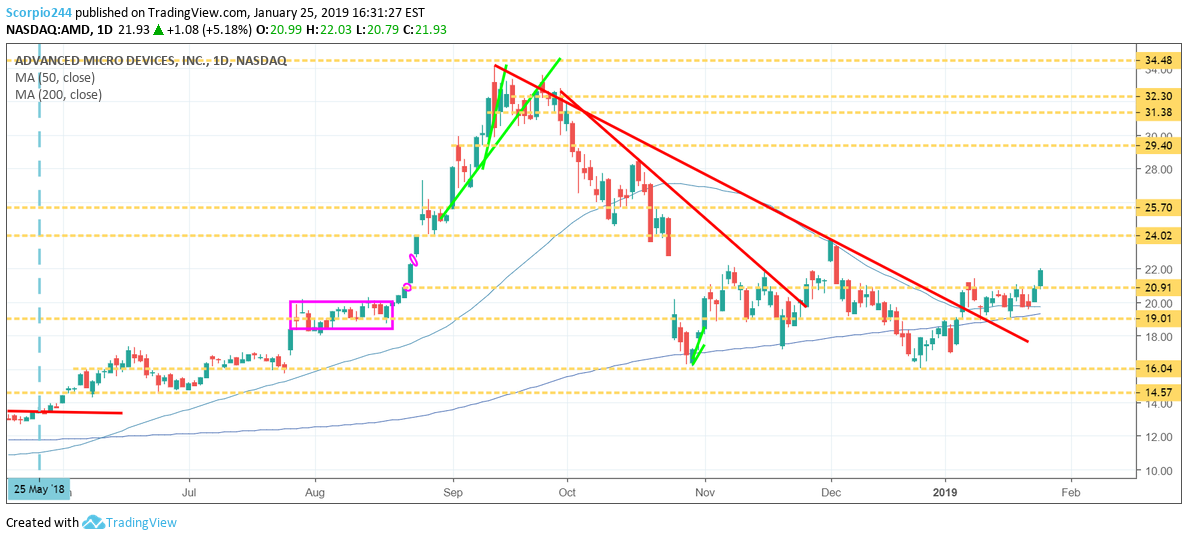
Well, add Advanced Micro Devices Inc (NASDAQ:AMD) to the list of stock I got wrong –again. The stock broke out today, rising above $21 and moved quickly towards $22. $24 is likely the next level of resistance.
Square (SQ)
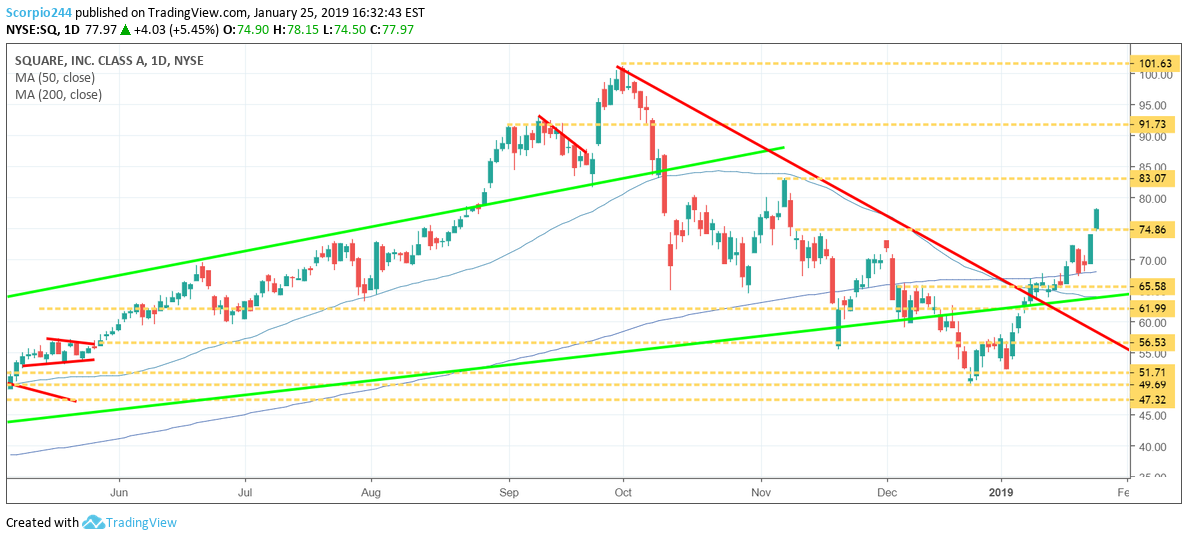
Square Inc (NYSE:SQ) has been on fire and $83 is looking very likely.
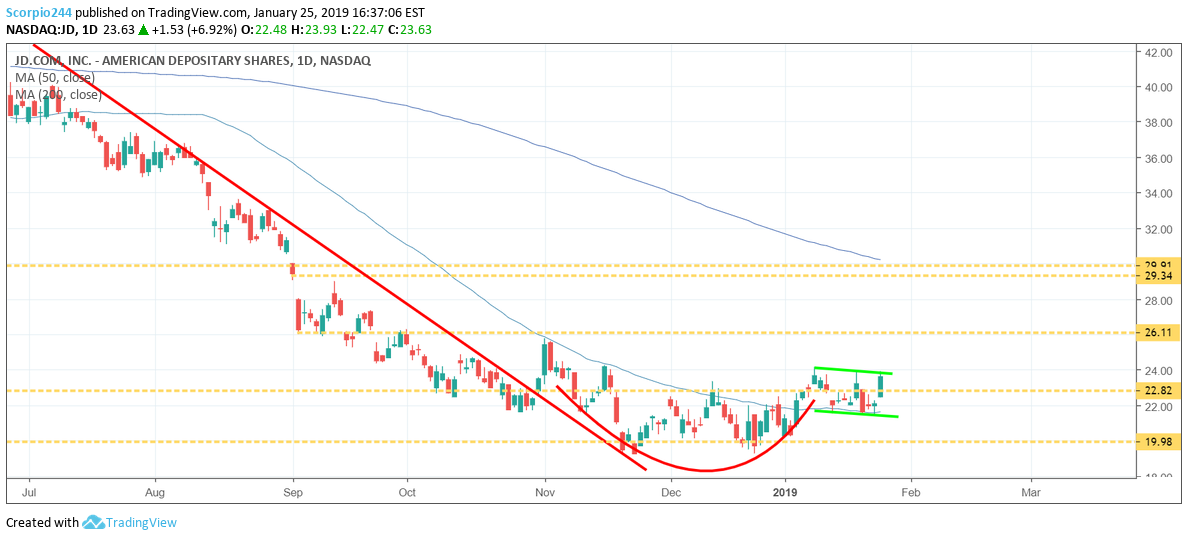
Jd.Com Inc Adr (JD)
Jd.Com Inc Adr (NASDAQ:JD) looks like it may have formed a bullish technical pattern known as a cup and handle. It could result in the stock rising to $26.
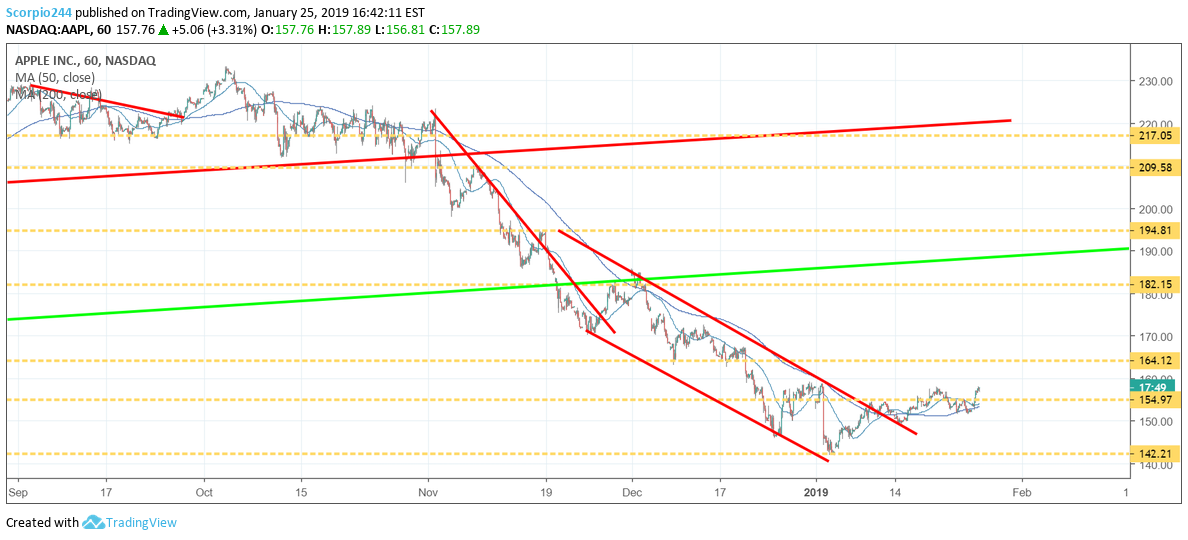
Apple (AAPL)
It figures that the day after I write that it looks we will have to wait for Apple Inc (NASDAQ:AAPL) to report results before the stock goes up, it rises 3% and breaks above resistance. $164 is in play
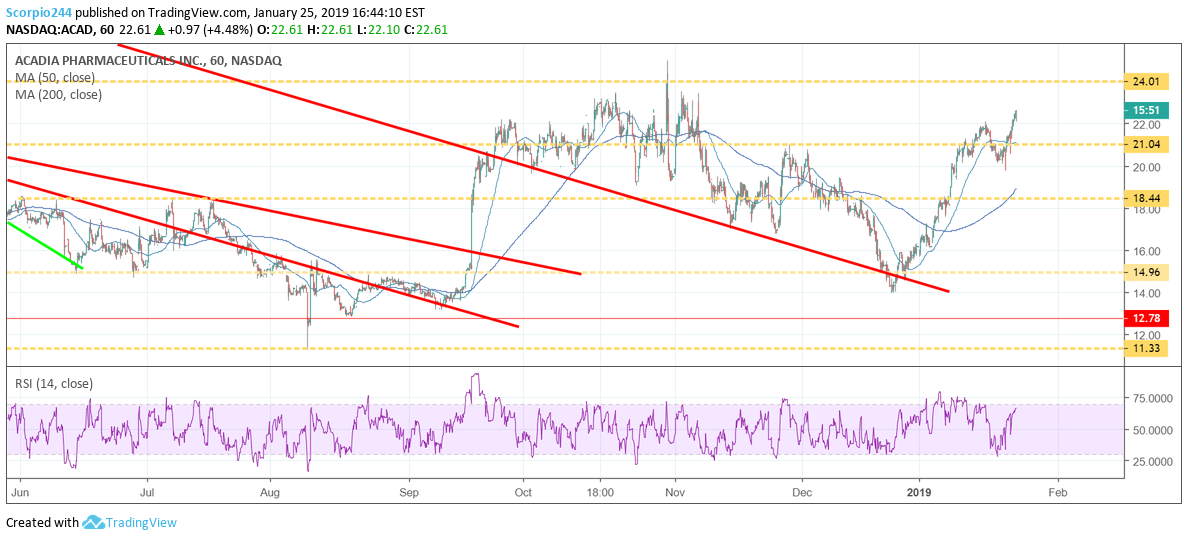
Acadia (ACAD)
ACADIA Pharmaceuticals Inc (NASDAQ:ACAD) is back to its highest level since November, and yes, once again an increase to $24 seems possible.
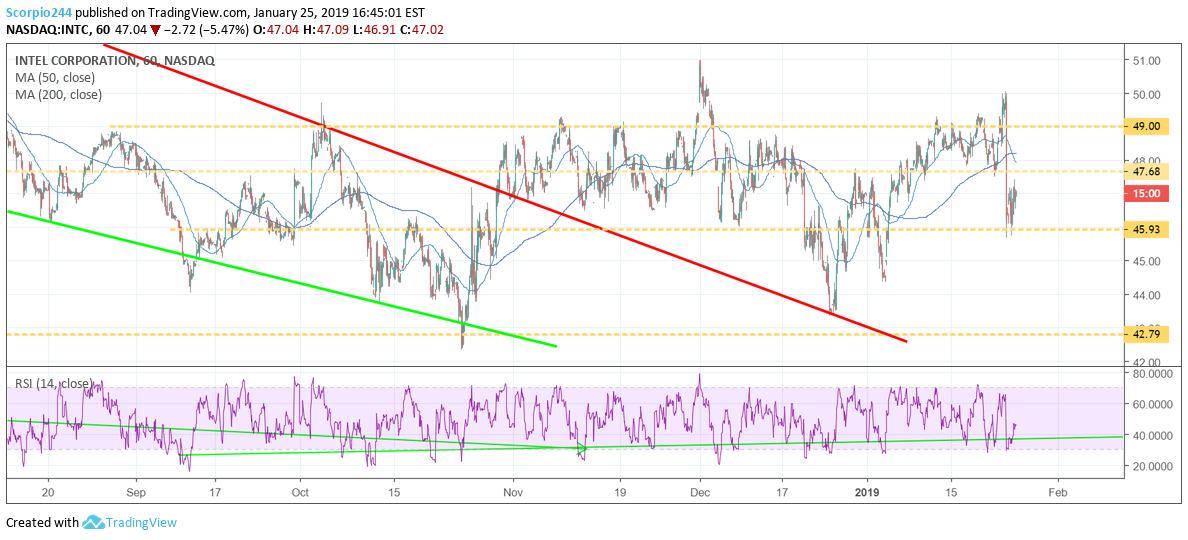
Intel (INTC)
The good news for Intel (NASDAQ:INTC) is that the stock held support at $46.
Disclaimer:
Michael Kramer and the clients of Mott Capital own Acadia and Apple.

