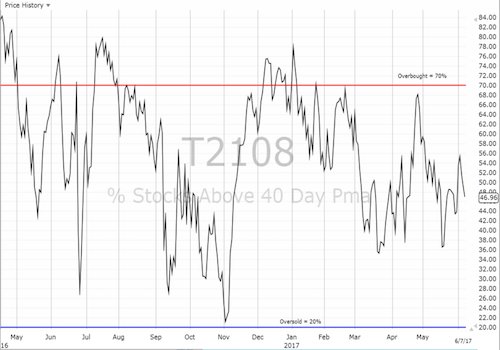
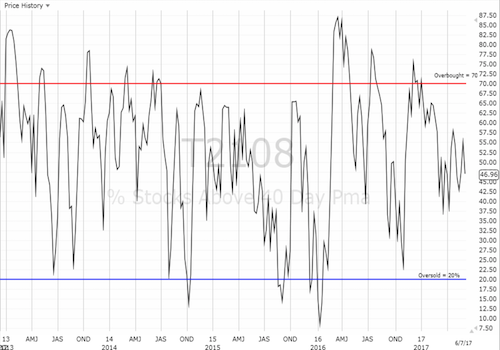
AT40 = 47.0% of stocks are trading above their respective 40-day moving averages (DMAs)
AT200 = 54.4% of stocks are trading above their respective 200DMAs
VIX = 10.4 (volatility index)
Short-term Trading Call: cautiously bullish
Commentary
At the time of typing, financial markets are carefully stepping into “Trifecta Thursday” – or maybe not so carefully if measured by the volatility index. The VIX remained amazingly calm ahead of what has been heralded as a key meeting on monetary policy form the European Central Bank (ECB), testimony from former FBI Director James Comey on Russian election meddling and President Trump’s potential connections to it, and a national election in the United Kingdom that is serving as yet another referendum on Brexit.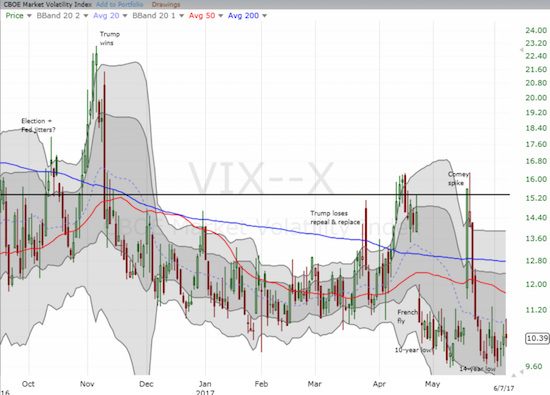
What worries? The volatility index, the VIX, is comfortably stuck near 14-year lows.
Contrary to the market’s remarkable calm, I decided to buy a handful of call options on ProShares Ultra VIX Short-Term Futures (NYSE:UVXY) expiring next week. I did not bother hedging with put options since my stock positioning is heavily skewed to the long side. If volatility does manage to wake up, I plan to close out the UVXY call options quickly given my assumption the current period of extremely low volatility likely presages an overall calm summer.
The calm is of course reflected in an S&P 500 (via SPDR S&P 500 (NYSE:SPY)) that is just off another set of all-time highs. Although this week started with an immediate reversal of the gains following last Friday’s U.S. jobs report, the index neatly bounced off the bottom of the upper Bollinger Band (BB) channel that defines the latest short-term uptrend.
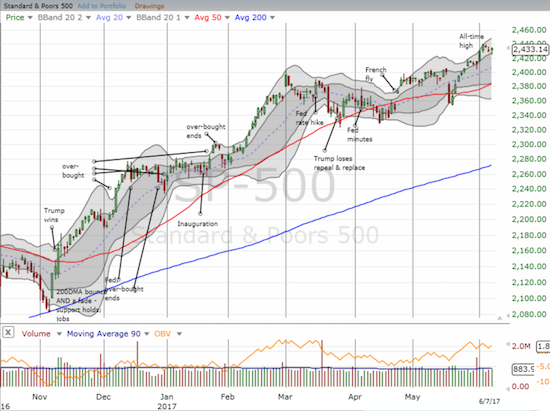
Despite small setbacks to start the week, the S&P 500 (SPY) is still in the middle of a robust bounceback from the one-day sell-off that broke 50DMA support three weeks ago.
While AT40 (T2108), the percentage of stocks trading above their respective 40-day moving averages (DMAs), brought fresh credibility to the rally with a convincing show of breadth last week, my favorite technical indicator returned quickly to its over-arching theme of wavering. AT40 closed last week at 55.3% and has lost ground for three straight trading days. It closed Wednesday at 47.0%. The downtrending energy sector is likely a culprit once again.
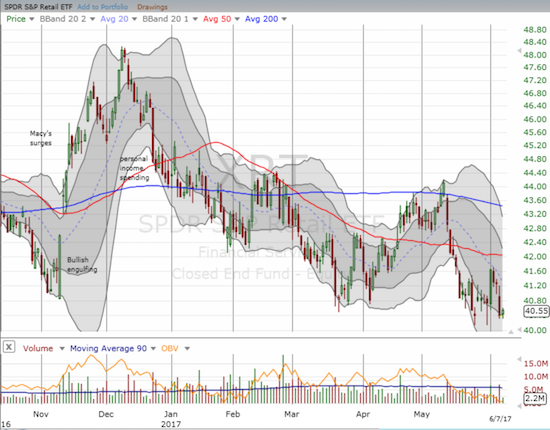
Fresh weakness also appeared in retail stocks with Macy’s Inc (NYSE:M) taking a shellacking on Tuesday after reporting guidance tainted by weaker margins. The storied retailer is approaching a 7-year closing low. Over the last two years, Macy’s has lost a whopping 68%. Macy’s helped drag the SPDR S&P Retail (NYSE:XRT) right back to its low of the year and a near 52-week low.
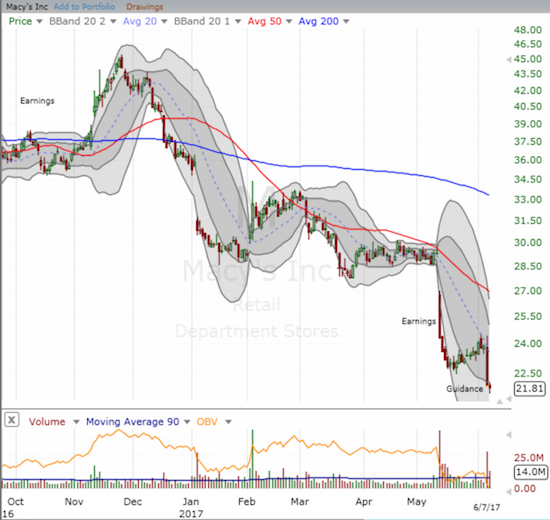
The troubles at Macy’s (M) seem to know no end.
The SPDR S&P Retail ETF (XRT) has closed in on a new 52-week low.
On May 26th, electronics retailer Conns Inc (NASDAQ:CONN) regained my attention after Best Buy Co Inc (NYSE:BBY)'s stellar post-earnings performance. I decided to wait for earnings before deciding to buy CONN. The stock went on to rally for the next five days going into earnings. The stock stumbled after reporting earnings. Before I could even think of buying this dip, CONN rallied off its post-earnings low and then soared 9.9% on Wednesday to finish closing the gap down.
Stifel reiterated a buy rating on CONN and upped its price target from $19 to $20. This strong trading action suggests CONN is still a buy (preferably on dips). It is hard to believe that CONN was trading at less than half of its current trading level just two months ago! CONN is now back to a 15-month high.
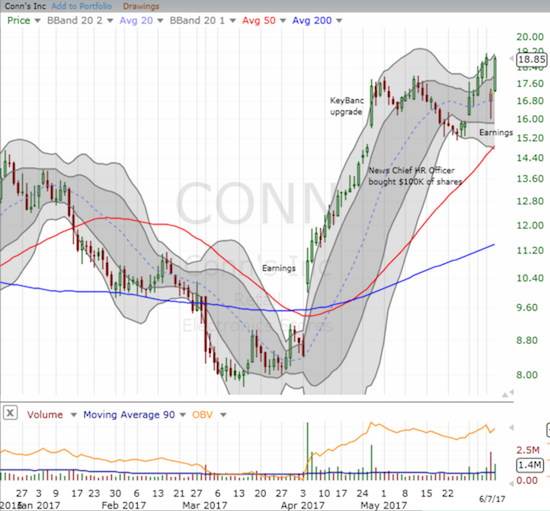
Conn’s (CONN) is enjoying quite the sudden renaissance!
Now I move on to see whether the market expresses any care or concern with Thursday’s trifecta. I will be watching the currency markets more closely than the stock market. Currency markets more consistently care about the day-to-day, hour-to-hour news cycles.
“Above the 40” uses the percentage of stocks trading above their respective 40-day moving averages (DMAs) to assess the technical health of the stock market and to identify extremes in market sentiment that are likely to reverse. Abbreviated as AT40, Above the 40 is an alternative label for “T2108” which was created by Worden. Learn more about T2108 on my T2108 Resource Page. AT200, or T2107, measures the percentage of stocks trading above their respective 200DMAs.
Active AT40 (T2108) periods: Day #326 over 20%, Day #146 over 30%, Day #13 over 40% (overperiod), Day #2 under 50% (underperiod), Day #28 under 60%, Day #98 under 70% (corrected from June 2, 2017 post)
Black line: AT40 (T2108) (% measured on the right)
Red line: Overbought threshold (70%); Blue line: Oversold threshold (20%)
Be careful out there!
Full disclosure: long UVXY call options, long BBY calls and puts
*Note QQQ is used as a proxy for a NASDAQ-related ETF

