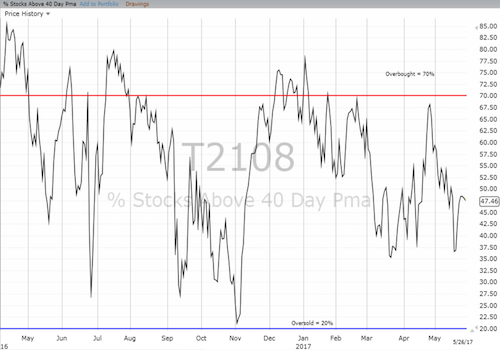
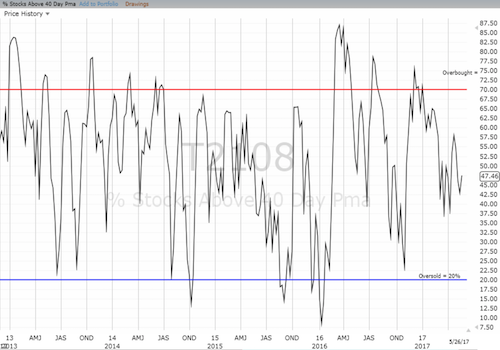
AT40 = 47.5% of stocks are trading above their respective 40-day moving averages (DMAs)
AT200 = 55.3% of stocks are trading above their respective 200DMAs
VIX = 9.8 (volatility index)
Short-term Trading Call: cautiously bullish
Commentary
I should no longer be amazed, but I am still amazed: the inability of sellers to generate follow-through in this market is quite profound.
At the end of last week, I characterized the Trump-inspired one-day sell-off and the immediate rebound as indicative of a nut job stock market. Within two more days, the entire loss on the S&P 500 (SPY (NYSE:SPY)) was reversed. In another two days, the S&P 500 hit a new all-time high. The index closed the week at a new all-time high by less than one point.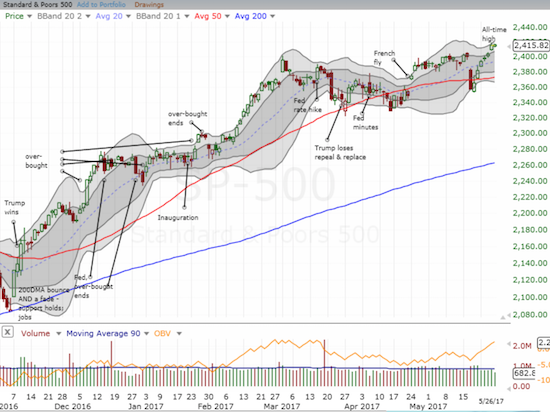
The S&P 500 (SPY) left the nut jobs in the dust with new all-time highs.
The recovery for the tech-laden NASDAQ (PowerShares QQQ Trust Series 1 (NASDAQ:QQQ))* was just as sharp and immediate.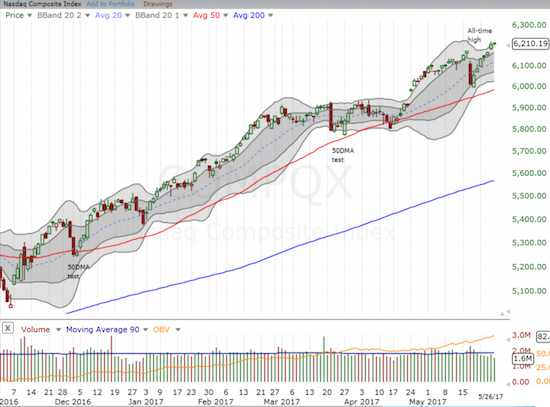
The NASDAQ (QQQ) also left the nut jobs in the dust with new all-time highs.
The return to “normalcy” has come with the now familiar extremely low volatility. The volatility index, the VIX, is back to single digits and a near 14-year low.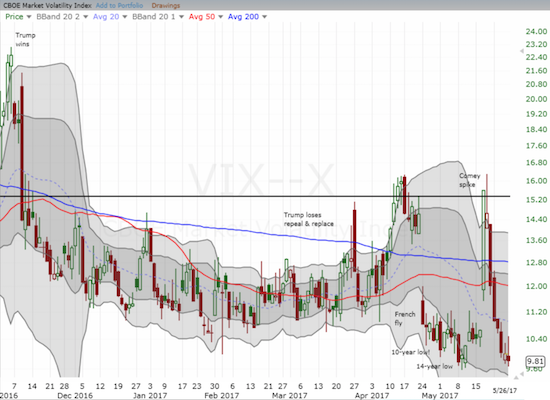
The volatility index, the VIX, is back to single digits as a soothing calm descends once again.
I think it is safe to say that the minimum 5% pullback I anticipated for May is on hold. That guesstimation was based on my historical analysis of prior periods of extremely low volatility. Now I assume that every time the VIX drops back into a period of extremely volatility, the clock resets. This latest reset pushes a 5%+ sell-off out to August. (I also need to consider a further refinement on the analysis).
Even as I look forward to a placid summer, I cannot help but watch out the corner of my eye the worsening divergence between the S&P 500 and my favorite technical indicator, AT40 (T2108), the percentage of stocks trading above their respective 40-day moving averages (DMAs). The S&P 500 (SPY) powered to fresh all-time highs while leaving AT40 way behind. Before this week, the index last hit an all-time high on May 15th. AT40 closed that day at 50.4%. It closed today at 47.5% and looks completely stalled out already.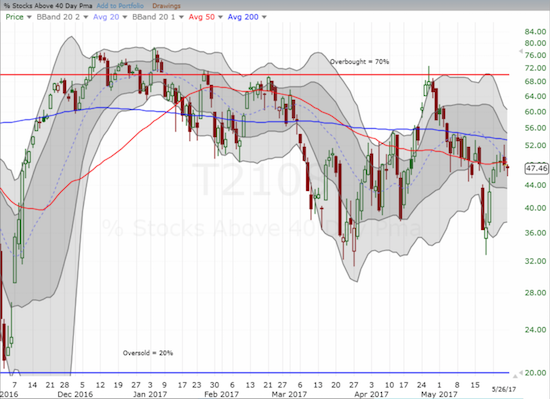
AT40 (T2108) has again stalled out at surprisingly low levels given the S&P 500 has hit fresh all-time highs.
AT200 (T2107), the percentage of stocks trading above their respective 200DMAs, looks worse. Not only is it trading below the May 15th level, but also it is still in the middle of a breakdown. Like AT40, AT200 declined on BOTH days the S&P 500 made new all-time highs.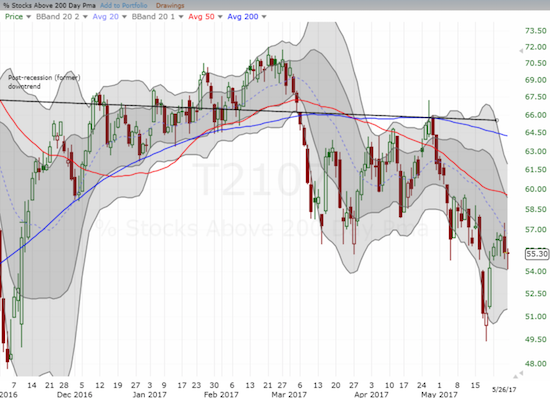
AT200 (T2107) is still in the middle of a breakdown despite the bullish price action form the major indices.
The combined behavior of these two indices require an interpretation caution. As I promised last week, I flipped the short-term trading call to cautiously bullish after the S&P 500 fully recovered from its 50DMA breakdown. I will keep the “cautious” qualifier until I see better behavior from AT40 and AT200.
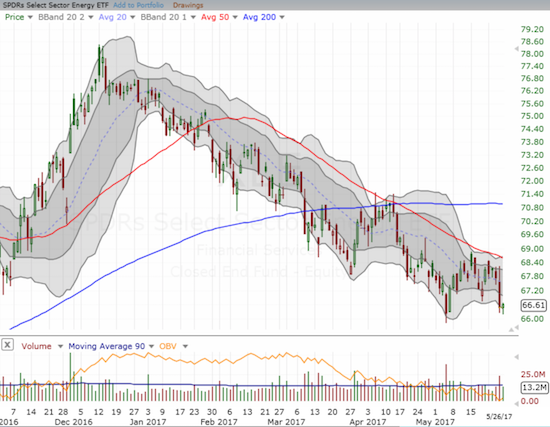
One likely culprit weighing down on AT40 and AT200 is the Energy Select Sector SPDR ETF (NYSE:XLE). The downtrend on XLE has persisted all year. XLE has produced an amazingly straight and consistent 50DMA downtrend since February. On Thursday, oil prices plunged in the wake of the latest OPEC meeting and sent XLE tumbling anew even as the S&P 500 made a new all-time high. That 50DMA stood tall as resistance.
The Energy Select Sector SPDR ETF (XLE) once again confirmed its downtrending 50DMA as resistance.
Financials are also pushing the caution button. The Financial Select Sector SPDR ETF (NYSE:XLF) has yet to recover fully from last week’s Trump Turmoil, and XLF could not fight through 50DMA resistance after four straight days of trying. The looming danger of a bearish breakdown from a head and shoulders (H&S) pattern remains. (The glass half full folks will rightly point out that a breakout above the right-hand shoulder would be bullish).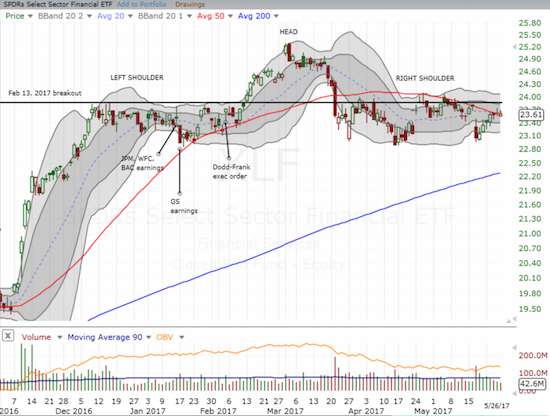
The Financial Select Sector SPDR ETF (XLF) hangs in a precarious balance at the edge of a bearish head and shoulders breakdown and below 50DMA resistance.
Best Buy (NYSE:BBY) is on the other side of caution. The stock market has spent weeks lamenting the relentless decline of retailers even as the outlook for the economy is as chipper as ever. Thursday morning delivered a bit of a wake-up call with BBY earnings sparkling apparently thanks to gaming sales. The gap up (14%) alone was impressive. BBY then proceeded to tack on another 4 more points, on its way to a new all-time high and a whopping one-day, post-earnings gain of 21%. Imagine THAT: an old-school, big box retailer, selling a bunch of goods readily available on Amazon.com (NASDAQ:AMZN) at a new all-time high!
This earnings season, I have typically bought early into such monster moves for a potential quick flip. This time, my old post-earnings rule of fading BBY at the open took over. Only after two tranches of puts on a one point move and then a 3+ point move form the open, did I realize I should have treated BBY as any other major gap up in the middle of an uptrend. Only Friday’s 3.7% slide gives me any hope that this position may yet deliver profits before BBY resumes its momentum.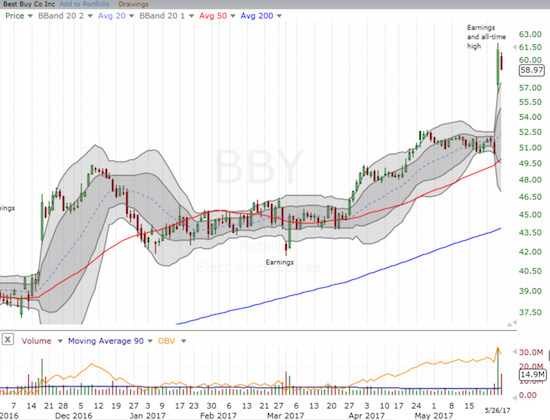
Best Buy (BBY) is suddenly a giant among retailing mice!
This post-earnings performance has me wondering aloud about the potential surprises electronics retailer Conns Inc (NASDAQ:CONN) might have in store when it reports earnings sometime in June. Can CONN benefit like BBY or did BBY vacuum up whatever non-Amazon money is out there getting spent on electronics? CONN’s powder keg could include vicious short-covering as 41% of its float is currently sold short. Best Buy has (had?) 16% of its float sold short.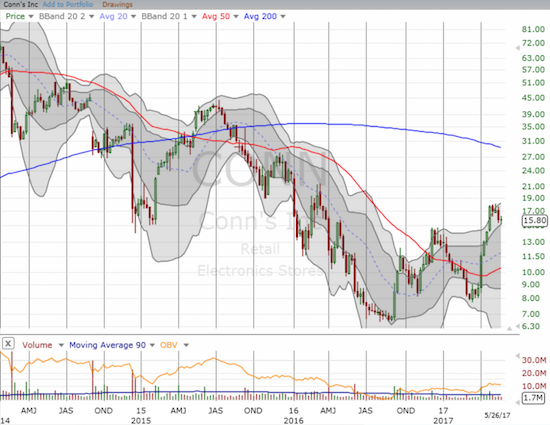
Conn’s Inc. (CONN) has already more than doubled off its 2017 low. Can it keep up this sharp recovery from years of selling?
“Above the 40” uses the percentage of stocks trading above their respective 40-day moving averages (DMAs) to assess the technical health of the stock market and to identify extremes in market sentiment that are likely to reverse. Abbreviated as AT40, Above the 40 is an alternative label for “T2108” which was created by Worden. Learn more about T2108 on my T2108 Resource Page. AT200, or T2107, measures the percentage of stocks trading above their respective 200DMAs.
Active AT40 (T2108) periods: Day #319 over 20%, Day #139 over 30%, Day #6 over 40% (overperiod), Day #9 under 50%, Day #21 under 60%, Day #91 under 70%
Black line: AT40 (T2108) (% measured on the right)
Red line: Overbought threshold (70%); Blue line: Oversold threshold (20%)
Be careful out there!
Full disclosure: no positions
*Note QQQ is used as a proxy for a NASDAQ-related ETF

