This post is NOT a prediction. All traders should constantly challenge their own biases to determine if such biases can stand up to scrutiny.
A bearish interpretation of the charts of the major U.S. stock market indexes is coming into clearer focus. While the trend of U.S. equities remains up, the charts indicate a time for caution. This post will look at some of the major indexes one at a time:
New York Stock Exchange Composite Index
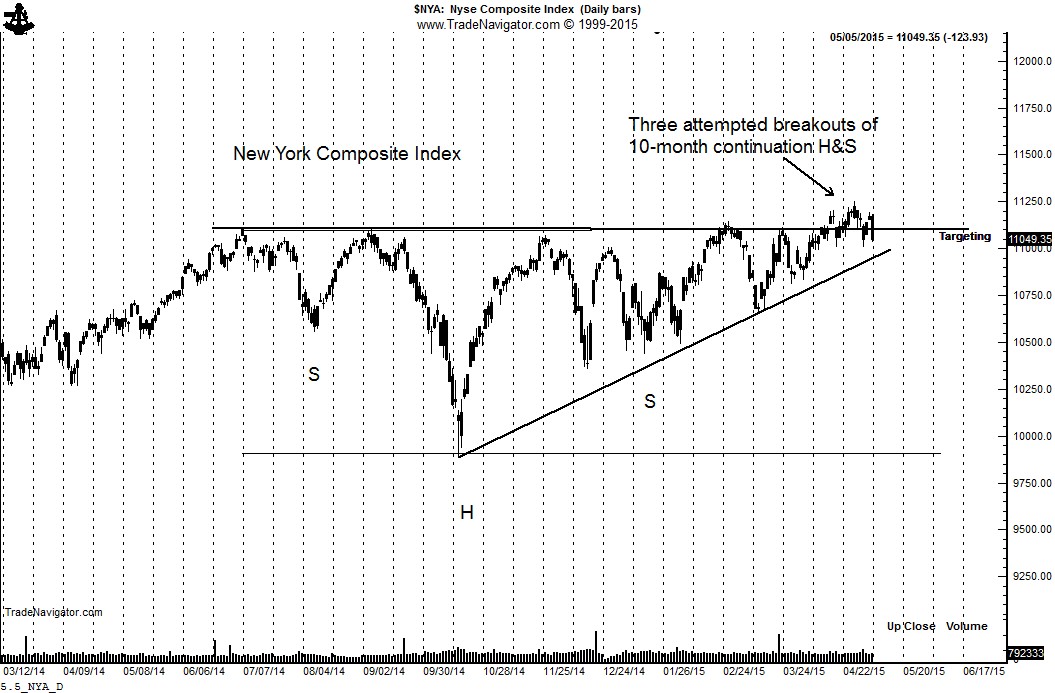
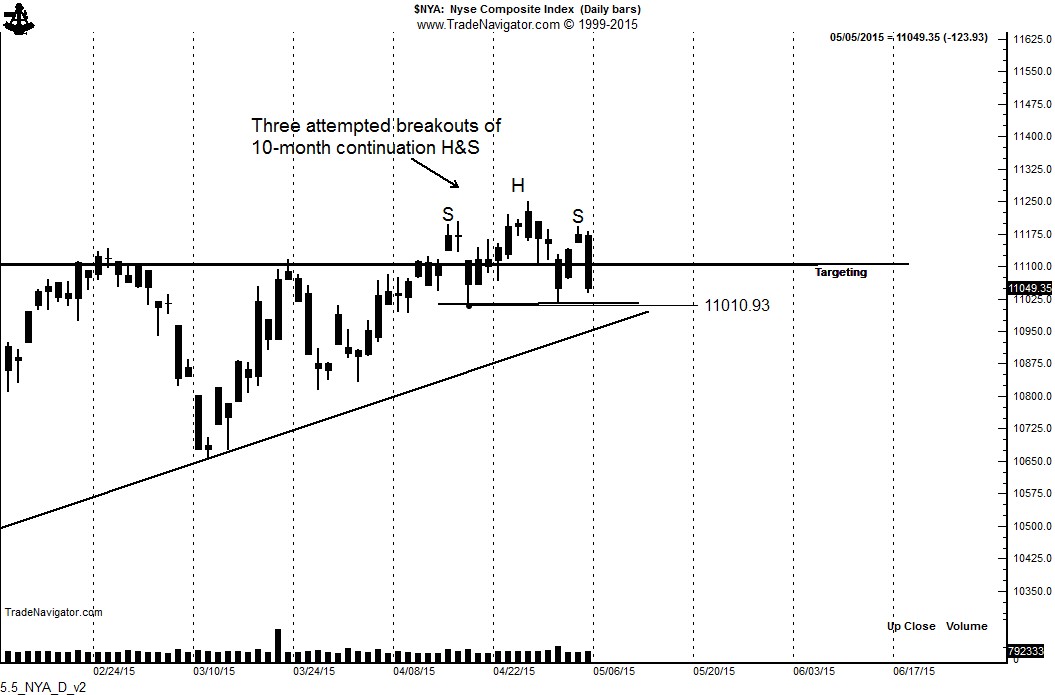
At times, the failure of a completed chart pattern to successfully launch a trend tells a story. In recent weeks the NYSE Composite has attempted three completions of a 10-month H&S pattern. All three have failed to develop momentum. This is a negative sign. The daily chart now displays a possible 3-week H&S top. A close below 11,000 would confirm the failed upside breakouts as part of a bull trap.
DJIA
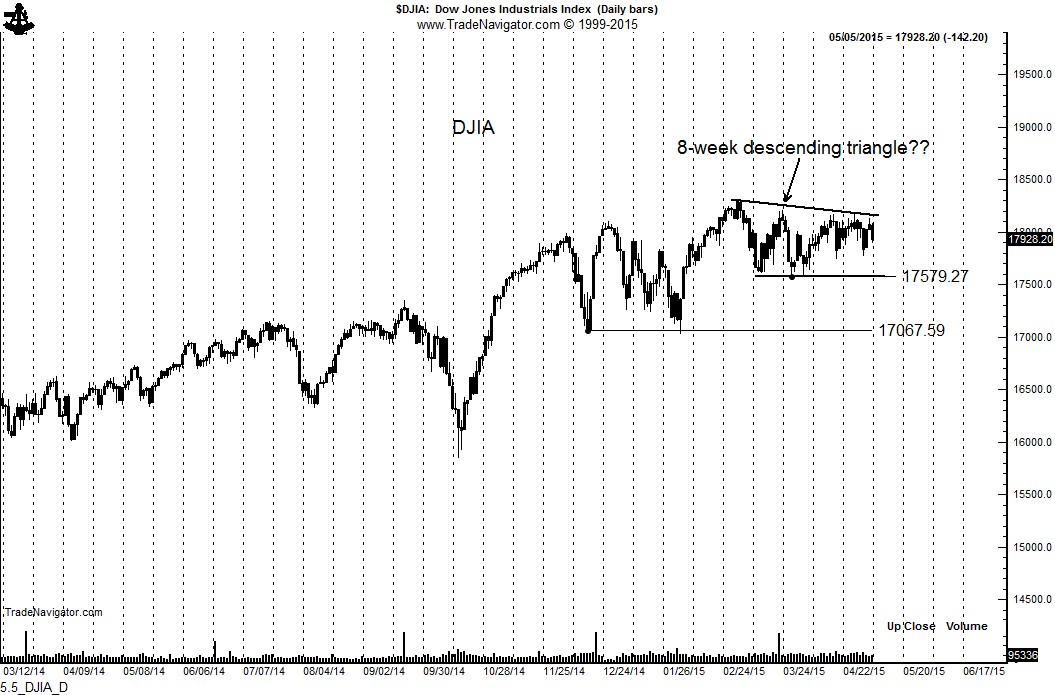
The DJIA is forming a possible descending triangle pattern. A close below 17550 would complete this pattern and set up a test of 17000. More importantly, the DJIA daily chart runs the danger of rolling over into a larger top.
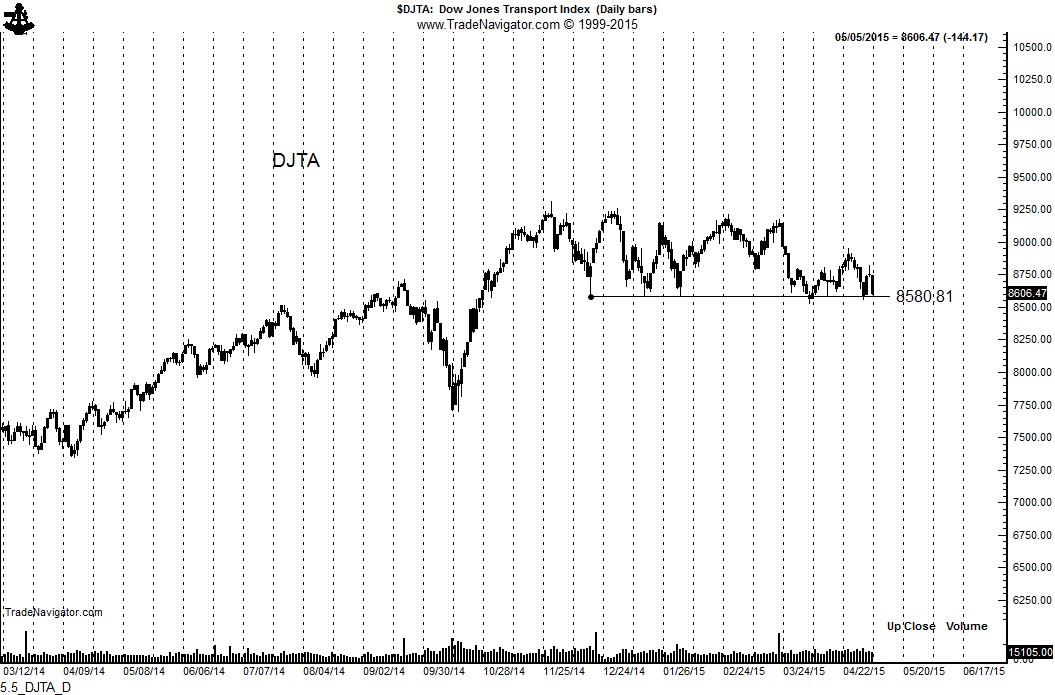
Dow Jones Transport Average
The daily chart of DJTA would be in a precarious position if support at 8580 gives way.
Dow Jones Utilities
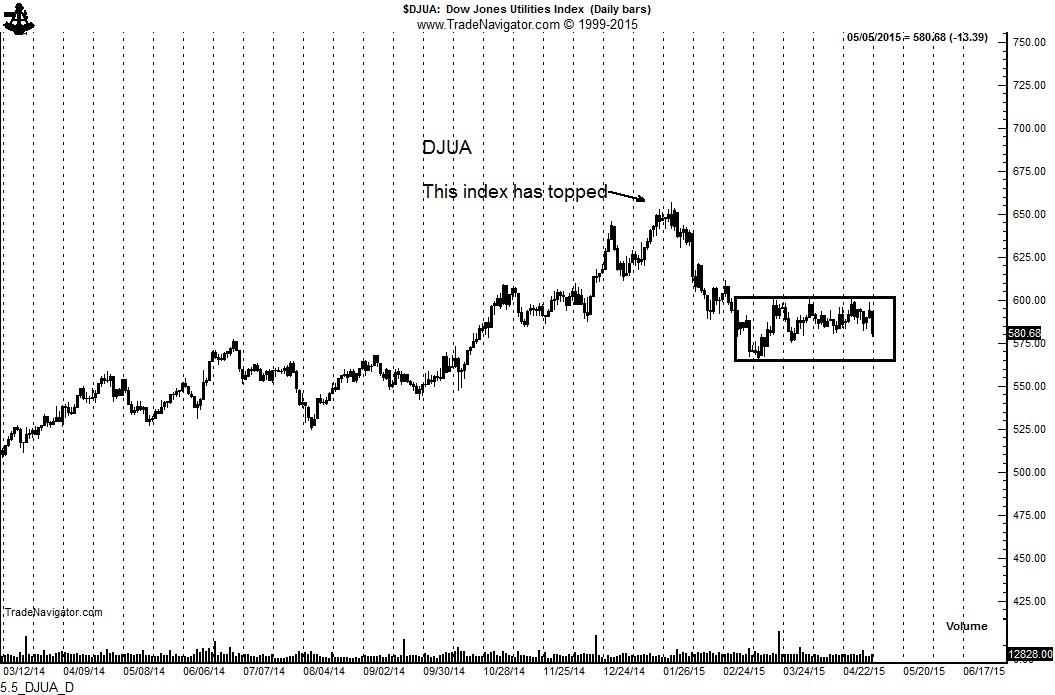
The daily graph of the DJUA has already topped. The current congestion zone appears to be a consolidation within a bear trend.
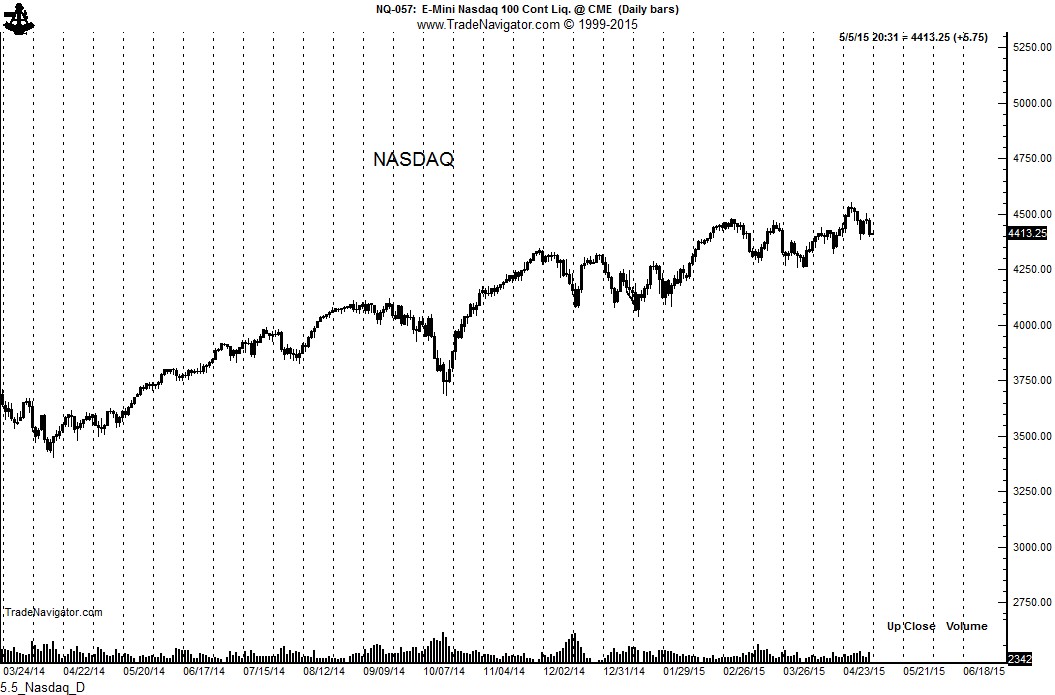
NASDAQ
The tech heavy NASDAQ is the healthiest of the major U.S. equity indexes. The daily NASDAQ graph cannot be interpreted bearishly … at this time.
Factor LLC is a proprietary trading firm founded in 1981 at the Chicago Board of Trade. Since inception, Factor has relied on classical charting principles for its trading operations.
The information in this blog post represents my own opinions and does not contain a recommendation for any particular security or investment. I or my affiliates may hold positions or other interests in securities mentioned in the Blog, please see my Disclaimer page for my full disclaimer.

