🤑 It doesn’t get more affordable. Grab this 60% OFF Black Friday offer before it disappears…CLAIM SALE

7 Key ETF Funds To Watch This Week

Published 03/08/2021, 12:53 AM
Updated 07/09/2023, 06:31 AM
EEM
-
QQQ
-
GLD
-
IXIC
-
DJUSUT
-
LQD
-
GDX
-
SMH
-
XLU
-

Last week was very important to U.S. equity charts, and I have selected from my ETF watch list a collection of 7 in particular whose patterns merit close watching this week.

The first is Emerging Markets—iShares MSCI Emerging Markets ETF (NYSE:EEM)—which have completed a small but well-defined reversal pattern. Take note how prices have broken the year-long channel and that a move below the horizontal line will complete the pattern.
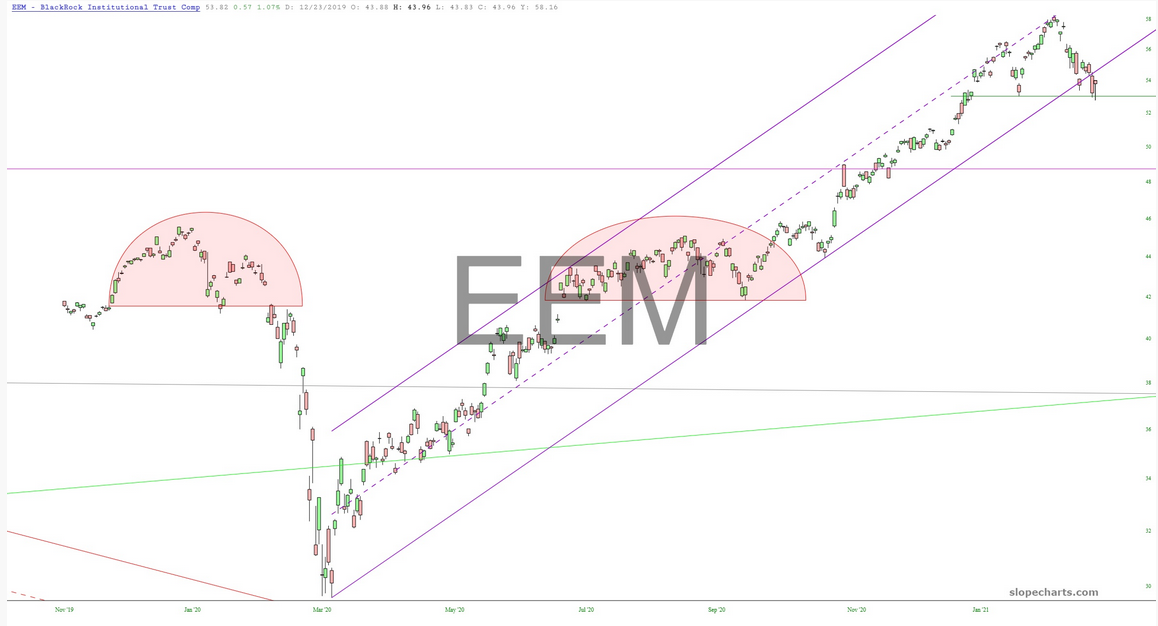
EEM Chart

Miners—VanEck Vectors Gold Miners ETF (NYSE:GDX)—completed an enormous right triangle pattern, and I think precious metals' awfulness is going to simply continue. Sure, it may bounce up to that triangle base once more, but whether it does or not, I think substantially lower prices are in store.
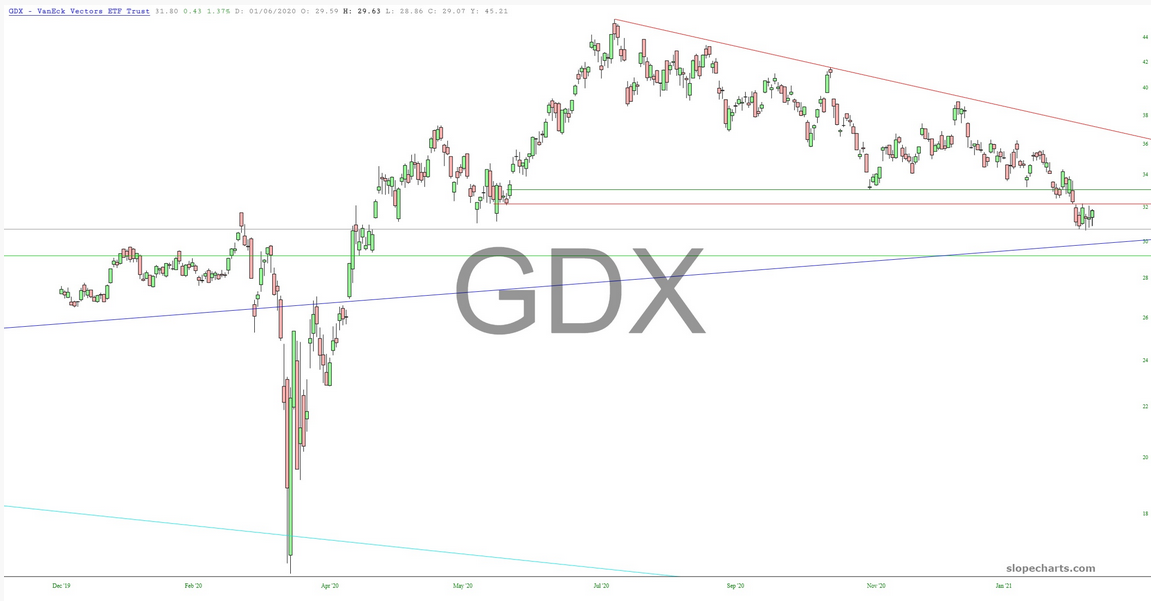
GDX Chart

Gold—SPDR® Gold Shares (NYSE:GLD)—may also bounce, and perhaps even more robustly, since it is a fair distance from its own triangle base. As with miners, however, I think the lower pathway is the clearest.
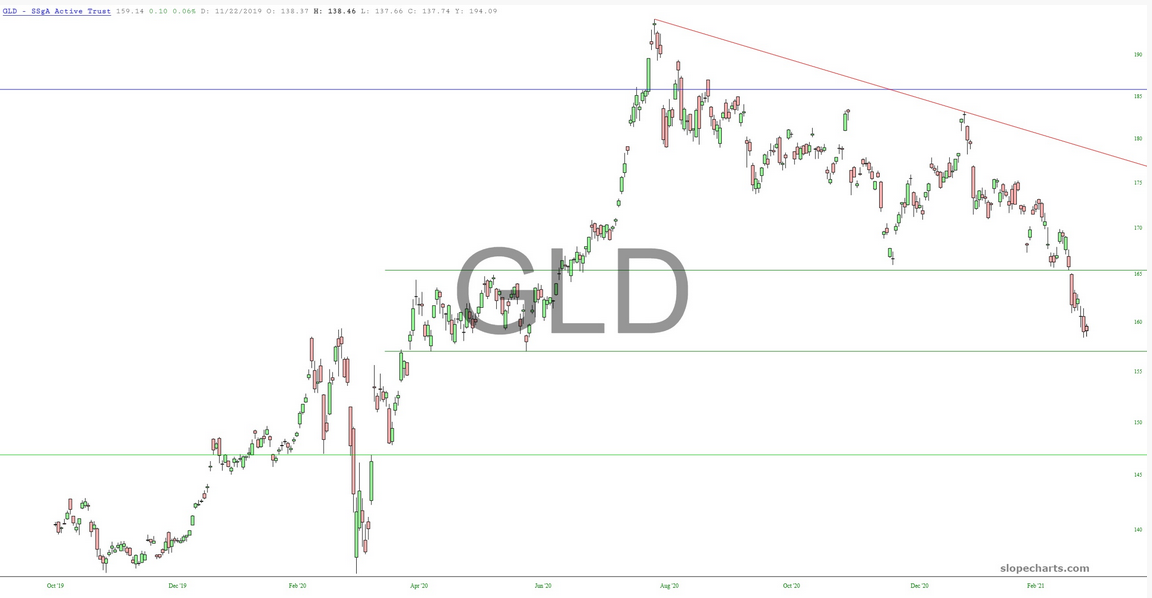
GLD Chart

Interest-sensitive instruments have been relatively tumultuous in recent weeks. The corporate bond ETF—iShares iBoxx $ Investment Grade Corporate Bond ETF (NYSE:LQD)—did a perfect touch of its trendline (twice, in fact) and is poised for a small recovery. The downtrend should continue, however.
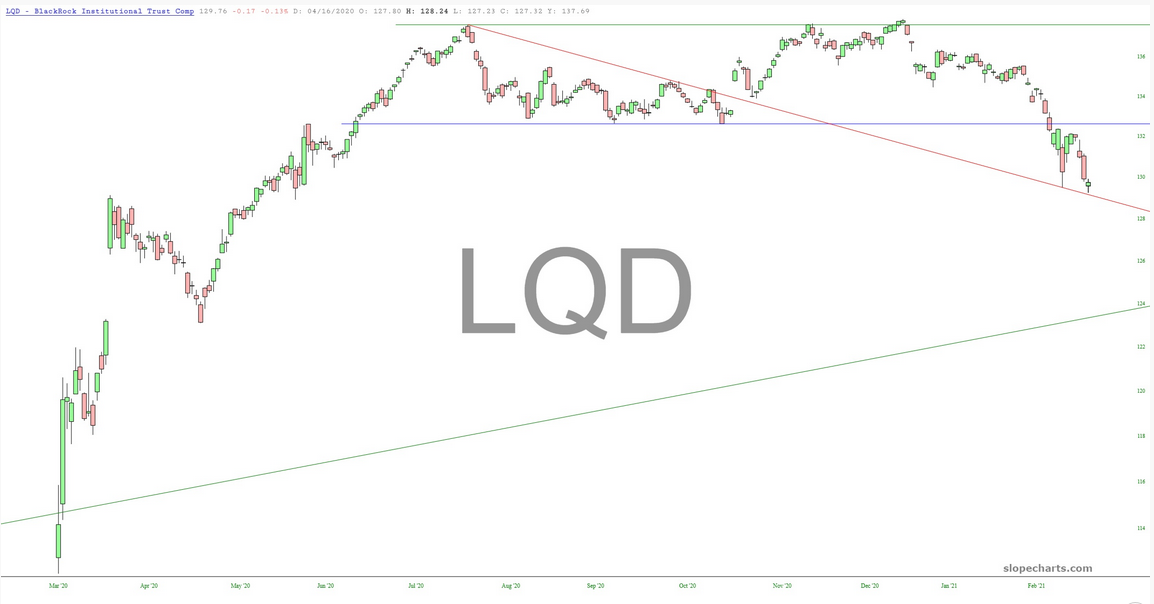
LQD Chart

The cleanest pattern, by far, has been NASDAQ (Invesco QQQ Trust), and the picture-perfect head & shoulders pattern completed this week with magnificent results. I suspect support will be available at the lower trendline shown.
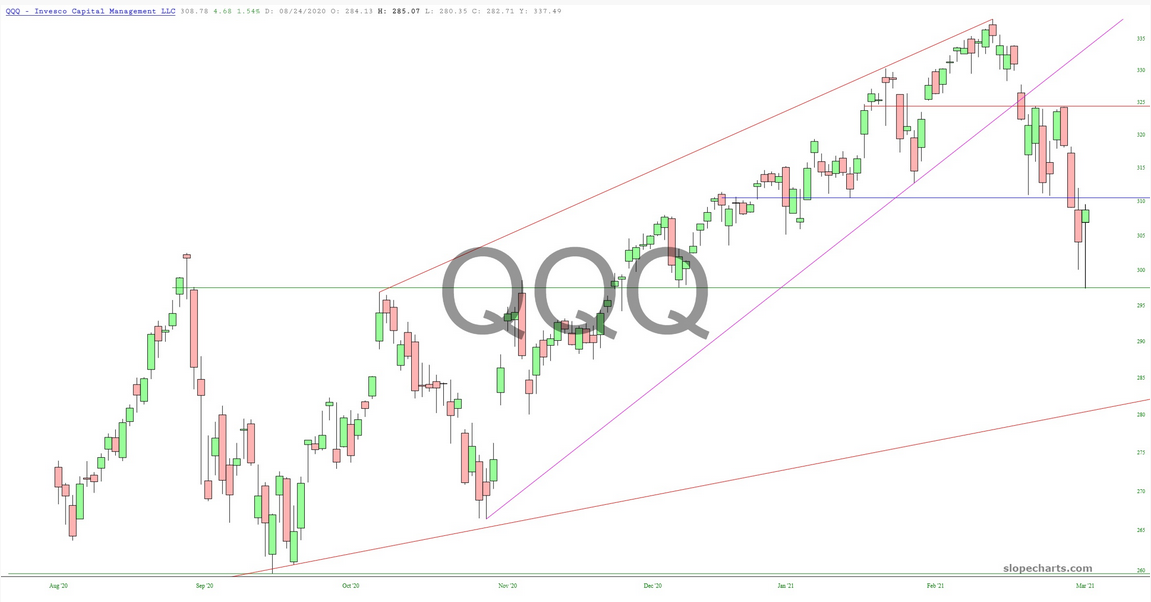
QQQ Chart

Arm-in-arm with NASDAQ is the semiconductor index—VanEck Vectors Semiconductor ETF (NYSE:SMH)—which has broken beneath its ascending price channel and has completed its own clean topping pattern. This price failure is a core reason I believe the tide is finally turning, since this sector has been such a stalwart holdout.
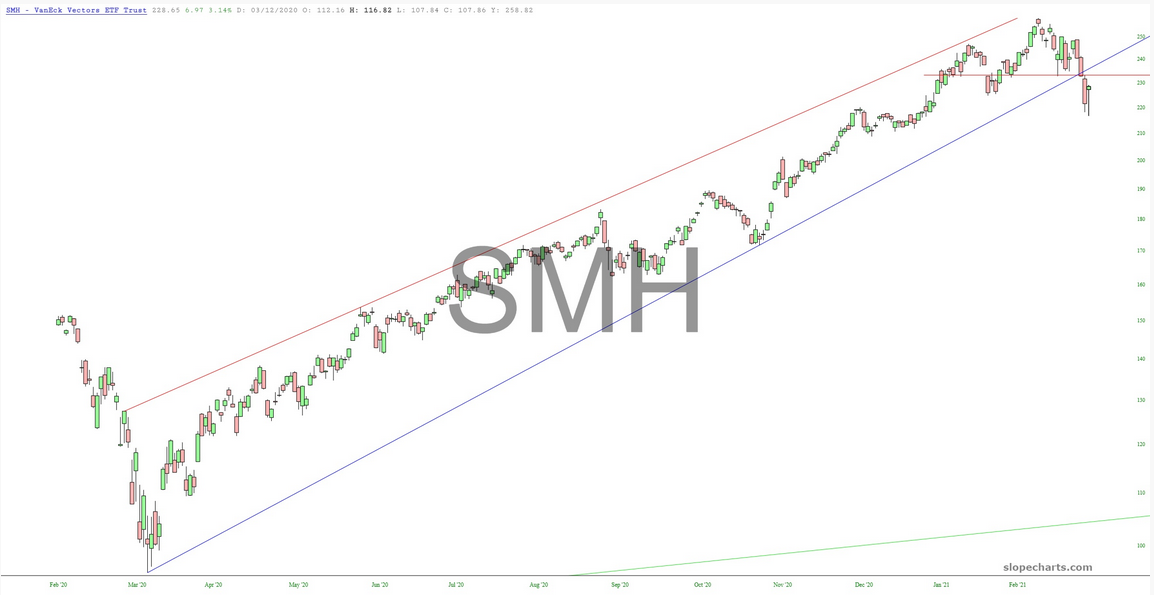
SMH Chart

Lastly is the Dow Jones Utilities—Utilities Select Sector SPDR® Fund (NYSE:XLU)—which has broken through three different uptrends. Utilities are, for most folks, so boring as to not even pay attention, but prior bear markets have all been preceded by a shift downward by the utility stocks, and this subtle breakdown is another clue for us.
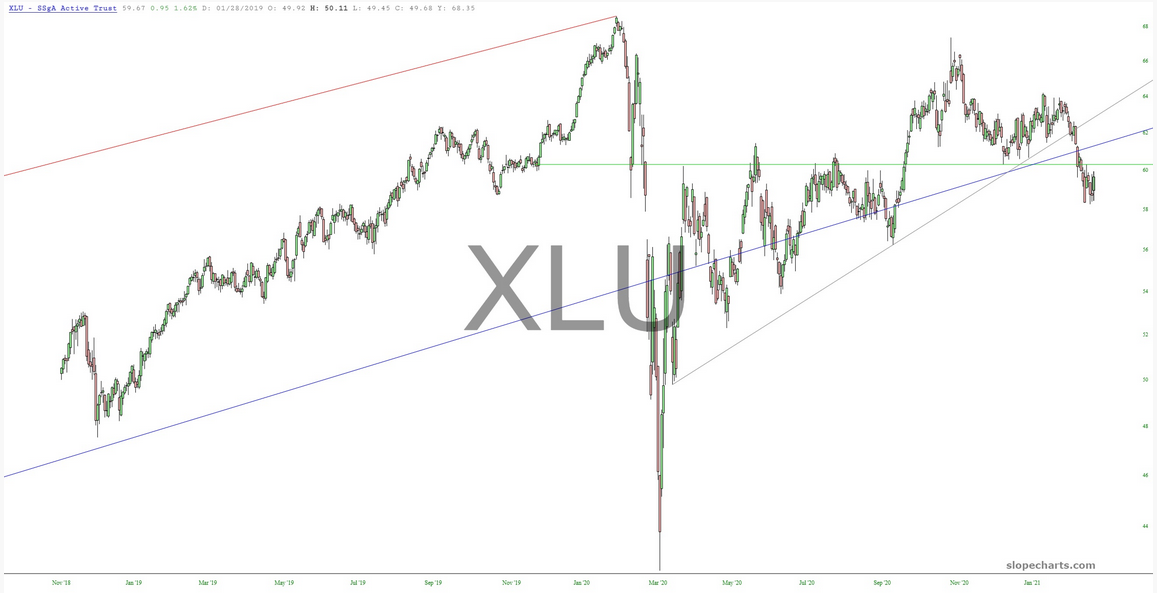
XLU Chart

Latest comments

Loading next article…
Risk Disclosure: Trading in financial instruments and/or cryptocurrencies involves high risks including the risk of losing some, or all, of your investment amount, and may not be suitable for all investors. Prices of cryptocurrencies are extremely volatile and may be affected by external factors such as financial, regulatory or political events. Trading on margin increases the financial risks.
Before deciding to trade in financial instrument or cryptocurrencies you should be fully informed of the risks and costs associated with trading the financial markets, carefully consider your investment objectives, level of experience, and risk appetite, and seek professional advice where needed.
Fusion Media would like to remind you that the data contained in this website is not necessarily real-time nor accurate. The data and prices on the website are not necessarily provided by any market or exchange, but may be provided by market makers, and so prices may not be accurate and may differ from the actual price at any given market, meaning prices are indicative and not appropriate for trading purposes. Fusion Media and any provider of the data contained in this website will not accept liability for any loss or damage as a result of your trading, or your reliance on the information contained within this website.
It is prohibited to use, store, reproduce, display, modify, transmit or distribute the data contained in this website without the explicit prior written permission of Fusion Media and/or the data provider. All intellectual property rights are reserved by the providers and/or the exchange providing the data contained in this website.
Fusion Media may be compensated by the advertisers that appear on the website, based on your interaction with the advertisements or advertisers.
© 2007-2024 - Fusion Media Limited. All Rights Reserved.