The average person has a vague idea that when the stock market is up it means the economy is better. For those who have 401ks or mutual fund savings and check them three or four times a year, the change is more visible. But the long bull market hasn’t brought retail investors back in droves, eager to buy and sell the only commodity that truly gets traded in any market: risk.
Many are still wary, thanks to the financial crisis. But risk by itself wasn’t the danger in 2008 and 2009. It was foolish and excessive risk taken on by banks and funds who should have known better, but thought they could privatize profits, pass the losses on to middle-class and working poor taxpayers, and get a bailout as a reward. Sadly, they got away with precisely that.
The bull market since that time, however, has been based in part on healthier risk: the risk of extending credit to job creators, rebuilding our infrastructure, reforming our healthcare system, and avoiding costly and needless war. We need more such risk-taking, but this long rally reflects some major changes in our economy.
The Big Picture
Remember that in March 2009, the iPhone was less than two years old, Google (NASDAQ:GOOG) had less than a billion monthly visitors, and Facebook (NASDAQ:FB), whose IPO was three years away, was just starting to see positive cash flow. (MySpace was still the #2 social network.)
Chrysler and GM (NYSE:GM) were preparing to file for bankruptcy. Bernie Madoff had just been arrested and Barack Obama inaugurated. Michael Jackson was rehearsing for his comeback concert in London. We were at war in Iraq.
If you were among those who stuck their necks out in 2009 you were paid handsomely for your efforts. Five years later the markets have gone so high that most people think stocks are “too high to buy and too firm to sell.”
Stocks are now in the second-longest bull market since 1946. The S&P has gone 2 1/2 years without the correction that typically occurs every 18 months. The markets may be nervous this year and traders may have unloaded some of the riskier shares in social media and biotechnology, but the S&P continues to move higher.
A holiday break is a good opportunity to look at the big picture, so let’s break down where all the major US indices stood going into the Memorial Day Holiday. While they are all upward lines, each index does have a unique path and pace.
Recently, for example, the Nasdaq has moved more quickly and the Dow has not been nearly the drama queen it usually is. That could change. A broad move across multiple sectors would involve the full momentum of the S&P 500.
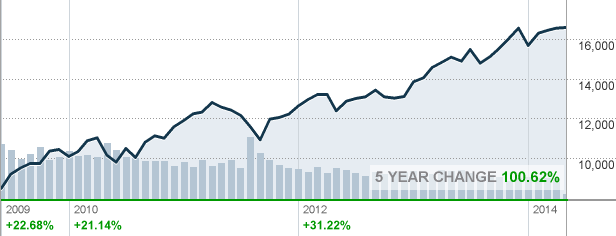
Dow

The Dow Jones Industrial Average closed up 63.19 points or 0.40%, to 16,606.27. For the week, the Dow gained 114.96 points or +0.70%. On the year the Dow is up a modest 29.61 points or up +0.20%. The Dow Jones is up 150.59% since March 2, 2009.
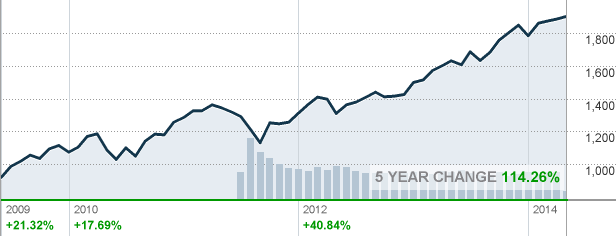
S&P 500
The S&P 500 gained 8.04 points or 0.42 %, to end at 1,900.53, another new all time record up 8 out of 10 S&P sectors up on the day. The S&P posted its fifth daily advance out of the past six sessions, and its first weekly gain out of the past three. The S&P closed up 1.2% on the week and is now up 2.8% in 2014. The S&P ended Friday above 1900.00 and just below the record intraday high of 1,902.17 set on May 13 and above its record closing high of 1,897.45 the same day. The S&P has gained 52.17 points, or up +2.8% year-to date. Since making its March 12 year -low in March of 2009 the S&P has gained 182%. Currently, the S&P is trading at 1.75 times its reported earnings, the highest level since 2010. With over 75% of the S&P 500 companies that released results for the latest quarter have beaten estimates for profit, while 53 percent have exceeded projections for revenue. The S&P closed above 1,900 for the first time on Friday. The index is up 2.8% this year compared with 16% gain over the same period last year.
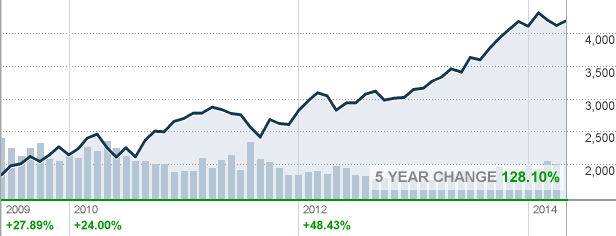
NASDAQ Comp.
The Nasdaq Composite closed up 31.47 points or 0.76%, to 4,185.81. Nasdaq touched 52-week high on Friday and closed the week out up 95.22%, or +2.3%. For the year, the Nasdaq has gained 9.22 points, or is up +0.20%. Since the market bottom in March 2009, the NASDAQ composite is up 231%.
Russell 2000
The Russell 2000 (RUT) index of small-cap shares rose 1.1% on Friday but gained 2.6% over the last 3 trading days. The index tumbled 9.3% after making is March record high. The Russell was hit the hardest this year as investors fled some of last years biggest performers. Overall, since March of 2009 the Russell 2000 has risen just over 220%.
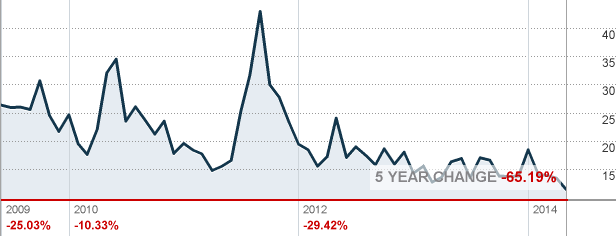
VIX: The Fear Gauge
The CBOE VIX is flashing warning lights. The VIX fell -5.6% last Friday to end at 11.36, the lowest level it has traded at since March 2013. The steady drop in the VIX which is know as the “fear gauge” is trading at historically low levels.
With stocks up so much over the last several years the VIX is starting to show an extremely high level of complacency—the highest in over five years. Generally, the VIX is a great indicator for when the stock market is overbought and ready to correct.
The challenge with long bull markets is that with every new high, you have people saying things like “overbought,” “complacent,” and “ready to correct.” At some point, all of us will be proven right and some may even claim that they were the first to call it.
But for those of us who buy and sell risk, what do you do when it’s “too high to buy” and “too firm to sell”? Consider something we’ve suggested before: some cheap, deep out-of-the-money put options with plenty of time left until expiration. If and when a volatile drop happens, you’ll have a low-cost insurance policy in place to make sure you don’t miss out.


