Here is your Bonus Idea with links to the full Top Ten:
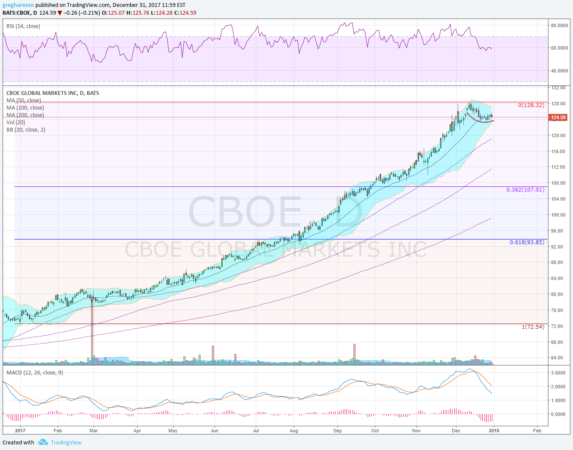
CBOE Holdings Inc (NASDAQ:CBOE) has a beautiful chart, rising for all of 2017 in a slowly increasing parabola, only eclipsed by the chart of Bitcoin. The SMA’s are rising in parallel, the 20 day SMA has acted as support throughout the journey higher. This is the type of stock that truly conservative technical traders watch go from 75 to 125 waiting for a pullback to get in and never getting it. It is also the type of stock a trend trader holds their nose and just buys, riding the wave higher. And after this meteoric rise you might think it is time to sell as the stock has pulled back the last 3 weeks of December.
That is the easy setup, trading a reversal lower. Everyone is looking for it to happen. And it might happen. But the shallow pullback also could be indicative of a digestive move, prepping for the next leg higher. How do you know which it is? Simple, watch the price action. The consolidation over 124 suggests that a move under that figure could give a good entry to trade the stock to the short side. Price levels of interest below would include the 38.2% and 61.8% retracements from the full move higher off of the January base, at 107 and 93.85. Additionally the 50, 100 and 200 day SMA’s have not been touched since November 2016.
The tougher trade will be to the upside. Should the price rise off of this consolidation back above 128 a renewed uptrend would be confirmed. How far could it go? Only time will tell. This type of price action would leave a good stop loss level behind to trade against though. Momentum is currently waning, but does this in both pullbacks and consolidation. And the RSI is still firmly in the bullish zone with the MACD positive. Reversals higher in both would be the first signal that the uptrend is continuing. The tight Bollinger Bands® are a sign that a move may be imminent. Short interest is moderate at 4.6%.
Looking at the options chains shows the January options with large open interest at the 120 Put Strike and then slightly smaller at the 130 Call Strike. This expiry suggests a slightly less than $5 range between now and then or from just under 120 to just under 130. The company is expected to report earnings next on February 5th. The first options covering that date, the February chain, suggest an $8 move between now and then. Open interest is lower than in the January chain but biggest at the 105 and 120 Put Strikes and the 130 Call Strike.
CBOE, Ticker: $CBOE
Trade Idea 1: Buy the stock on a move over 128 with a stop at 124.
Trade Idea 2: Buy the January 120/130 bull risk reversal (10 cent credit).
Trade Idea 3: Sell the stock short on a move under 124 with a stop at 128.
Trade Idea 4: Buy the February 120 Puts ($2.20) and sell the January 115 Puts (25 cents) and the February 105 Puts (35 cents) on a move under 124.
Trade Idea 5: Sell the January 120/130 Strangle ($1.30 credit).
After reviewing over 1,000 charts, I have found some good setups for the week. These were selected and should be viewed in the context of the broad Market Macro picture reviewed Friday which as 2017 comes to a close sees the equity markets limping into the last day, but holding near their all-time highs.
Elsewhere look for Gold to continue its uptrend while Crude Oil breaks higher as well. The US Dollar Index continues broad consolidation but with risk to the downside while US Treasuries are biased higher in their broad consolidation. The Shanghai Composite and Emerging Markets both continue to consolidate, the Chinese market after a pullback while Emerging Markets do so in their uptrend.
Volatility looks to remain very low keeping the wind at the backs of the equity index ETF’s SPDR S&P 500 (NYSE:SPY), iShares Russell 2000 (NYSE:IWM) and PowerShares QQQ Trust Series 1 (NASDAQ:QQQ). Their charts show short term consolidation of the long uptrends with digestion while the longer frames remain strong. Use this information as you prepare for the coming week and trad’em well.
DISCLAIMER: The information in this blog post represents my own opinions and does not contain a recommendation for any particular security or investment. I or my affiliates may hold positions or other interests in securities mentioned in the Blog, please see my Disclaimer page for my full disclaimer.
