ConocoPhillips (NYSE:COP)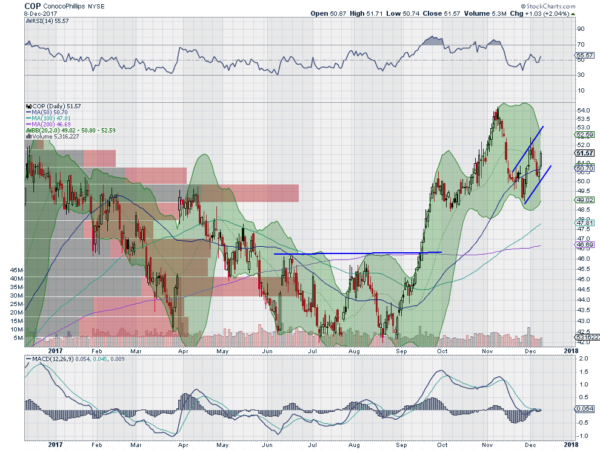
ConocoPhillips, $COP, rose out of a double bottom in September, pausing late in the month before a second leg higher. It pulled back to retest support into November and then reversed up again. Now with a higher high and higher low it is moving up again. The RSI is also rising and on the edge of a move into the bullish zone with the MACD flat at zero. Look for continuation higher to participate…..
Graco Inc (NYSE:GGG)
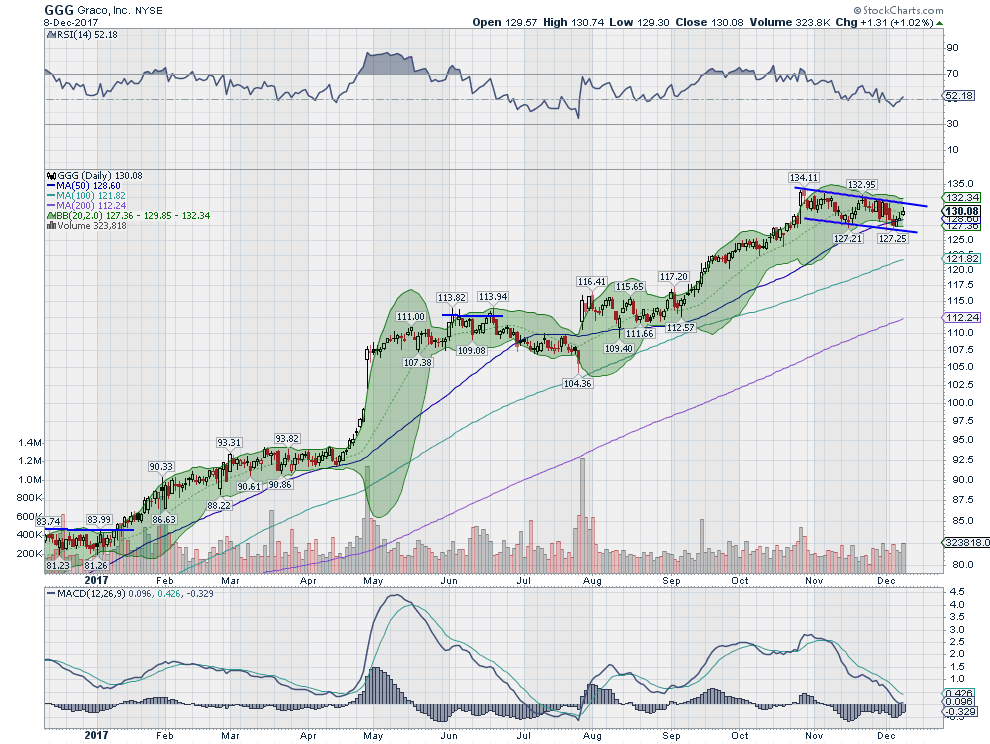
Graco, $GGG, moved up to a plateau in May that held until the gap higher in August. After a shorter consolidation it started higher again, continuing to a peak at the end of October. It has pulled back in a bull flag since, ending last week at the 50 day SMA. The RSI is holding in the bullish zone as it resets lower while the MACD is leveling at zero. Look for a break of the flag to participate…..
Honeywell International Inc (NYSE:HON)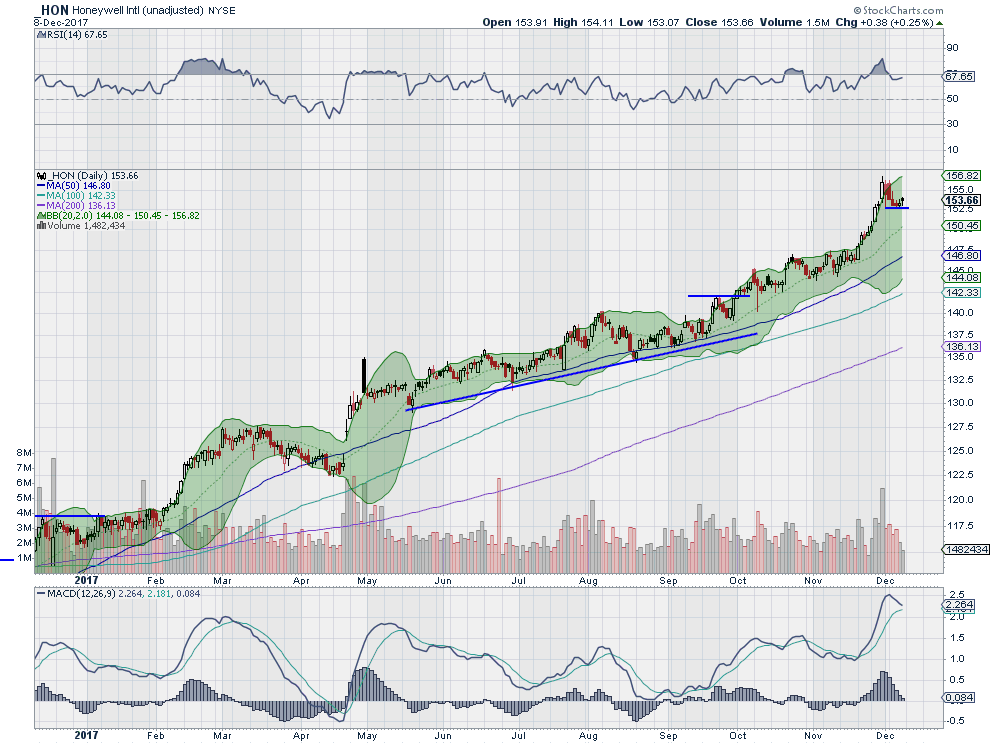
Honeywell, $HON, gapped higher in April and then rose steadily along trend support. The trend accelerated in September and then again in November, reaching a top at the end of the month. The price has had a minor pullback from there and Friday started back higher again. The RSI is also turning back higher with the MACD avoiding a cross down. Look for continuation to participate higher…..
PVH Corp (NYSE:PVH)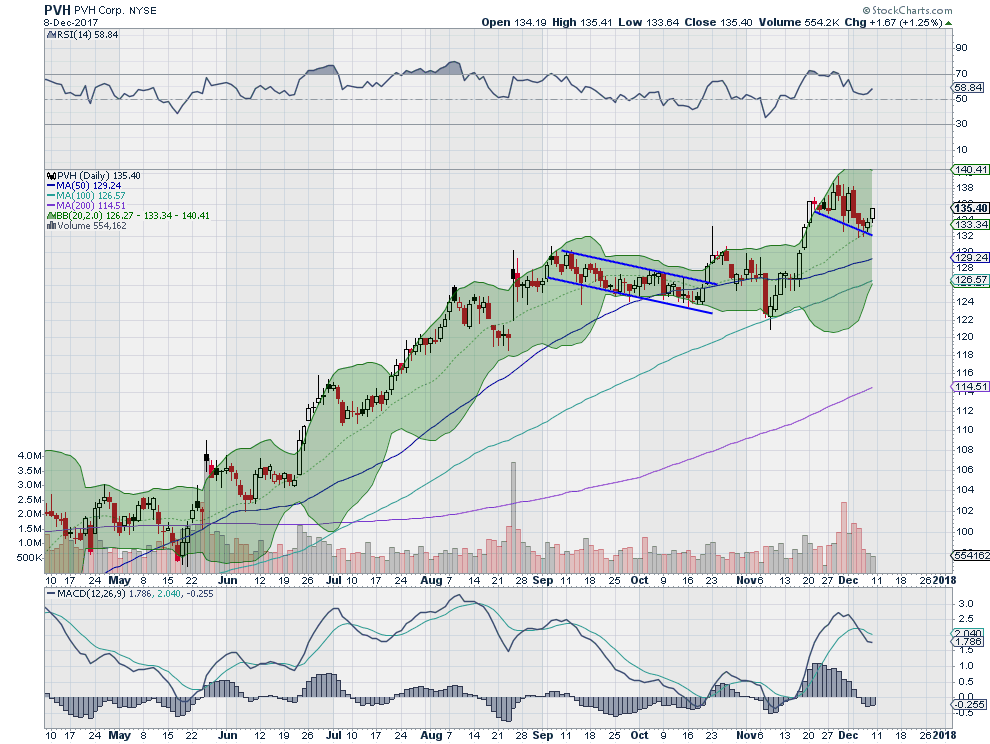
PVH, $PVH, had a long run higher after it crossed over its 200 day SMA in May. It paused in September and digested the move in a minor pullback before pushing higher again in November. Now it is retrenching again. The RSI is turning back higher in the bullish zone though with the MACD stopping its fall as the price took a small step higher Friday. Look for continuation to participate…..
UnitedHealth Group Incorporated (NYSE:UNH)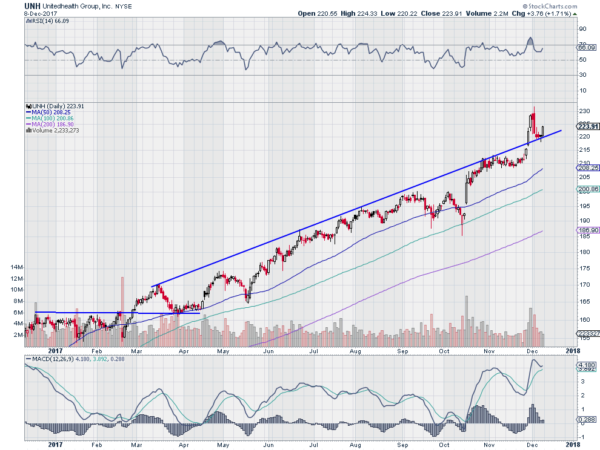
UnitedHealth, $UNH, started a long run higher in March as it broke above consolidation, retested the break out and then took off higher. It hiccupped a couple of times along the way in May and September into October, but recovered and continued up. At the end of November it broke above trend resistance and then came back to retest it last week. The RSI is turning back higher and the MACD is avoiding a cross down. Look for continuation to the upside to participate higher…..
Up Next: Bonus Idea
After reviewing over 1,000 charts, I have found some good setups for the week. This week’s list contains the first five below to get you started early. These were selected and should be viewed in the context of the broad Market Macro picture reviewed Friday which heading into the FOMC meeting and December options expiration week sees the equity markets showing some life. Perhaps the Santa Claus Rally has begun.
Elsewhere look for Gold to continue lower while Crude Oil stalls in its uptrend. The US Dollar Index is biased higher in consolidation while US Treasuries mark time sideways. The Shanghai Composite continues to retrench after a long run higher and Emerging Markets are seeking support as they retest breakout levels.
Volatility looks to remain very low keeping the wind at the backs of the equity index ETF’s SPDR S&P 500 (NYSE:SPY), iShares Russell 2000 (NYSE:IWM) and PowerShares QQQ Trust Series 1 (NASDAQ:QQQ). The SPY and QQQ remain strong on the weekly timeframe with the IWM showing some potential weakness. The SPY is also strong on the daily timeframe while eh IWM and QQQ are turning up but still looking for new highs. Use this information as you prepare for the coming week and trad’em well.
DISCLAIMER: The information in this blog post represents my own opinions and does not contain a recommendation for any particular security or investment. I or my affiliates may hold positions or other interests in securities mentioned in the Blog, please see my Disclaimer page for my full disclaimer.
