Boston Scientific (NYSE:BSX)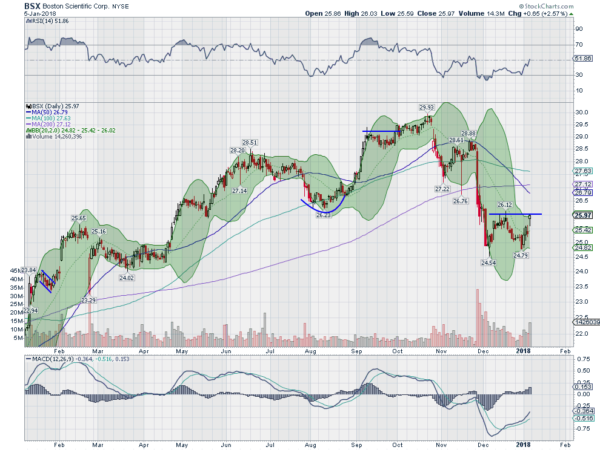
Boston Scientific, $BSX, started higher after the November 2016 election, taking several steps to get to the top in October 2017. It then corrected in two steps to the current base consolidation. The price action Friday took it back to the top of consolidation with the Bollinger Bands® squeezed in. This often precedes a big move. A push over the top of consolidation would confirm a double bottom reversal. The RSI is moving up through the mid line toward the bullish zone with the MACD rising. Look for a push over resistance to participate higher…..
Cigna (NYSE:CI)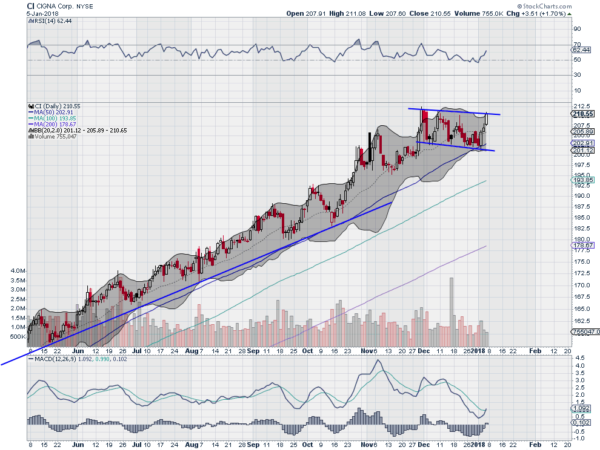
Cigna, $CI, moved steadily higher all year long until the current consolidation. At the end of last week it was at the top of that consolidation with the Bollinger Bands squeezed. It had retouched the 50 day SMA and has a RSI moving higher in the bullish zone with the MACD about to cross up. Look for a push to a new high to participate…..
Green Dot Corporation (NYSE:GDOT)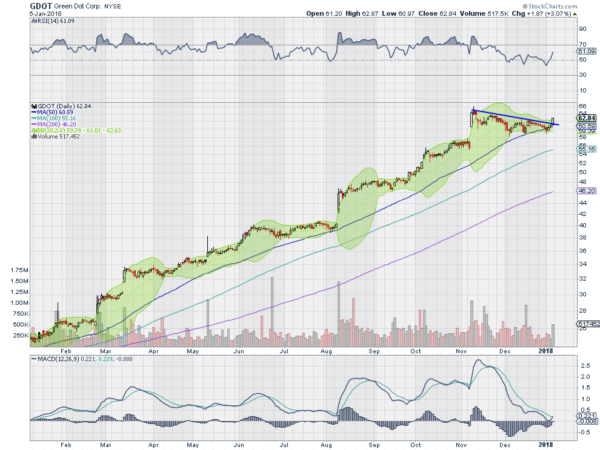
Green Dot, $GDOT, started higher at the beginning of 2017, lifting off of and continuing to the peak in early November. It has left a few small gaps along the way and a couple of consolidations, each time with the 50 day SMA holding as support. The price broke above the latest consolidation Friday and up off of that 50 day SMA. The RSI is rising in the bullish zone and the MACD is about to cross up. Look for continuation to participate higher…..
HP Inc (NYSE:HPQ)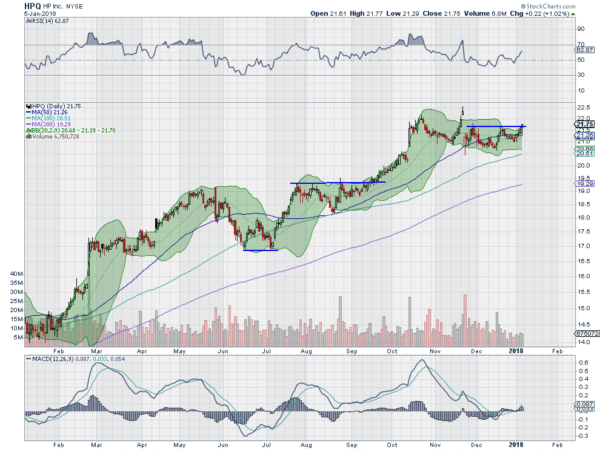
HP, $HPQ, moved out of a consolidation in September, racing to a top in October. After a small pullback it sprinted to a higher high and dropped again. It has been consolidating against resistance since. The Bollinger Bands have squeezed and are now starting to open to allow a move. The RSI is rising and bullish with the MACD moving higher as well. Look for a push over resistance to participate…..
3M Company (NYSE:MMM)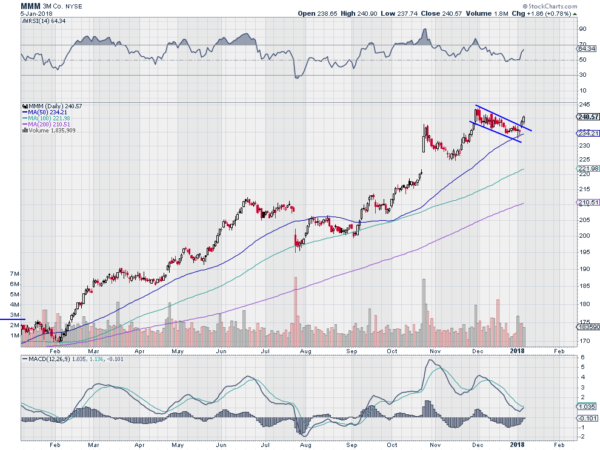
3M, $MMM, started higher out of consolidation in February, up off of its 100 day SMA. It stalled in June and digested the move before a second leg higher in October. That move topped out at the beginning of December and was followed by a bull flag. Friday saw the price break the bull flag to the upside. The RSI is running higher in the bullish zone with the MACD about to cross up. Look for continuation to participate higher…..
Up Next: Bonus Idea
After reviewing over 1,000 charts, I have found some good setups for the week. This week’s list contains the first five below to get you started early. These were selected and should be viewed in the context of the broad Market Macro picture reviewed Friday which with the first week of the New Year under our belts sees the equity markets looking spectacular, and maybe they have run a bit too far too fast.
Elsewhere look for Gold to continue in its uptrend while Crude Oil may pause in its move higher. The US Dollar Index is weak but may be finding support while US Treasuries are biased lower in consolidation. The Shanghai Composite and Emerging Markets have both broken to the upside in a strong manner out of consolidation.
Volatility looks to remain very low keeping the bias higher for the equity index ETF’s SPDR S&P 500 (NYSE:SPY), iShares Russell 2000 (NYSE:IWM) and PowerShares QQQ Trust Series 1 (NASDAQ:QQQ). Their charts agree on the longer timeframe, with the SPY and QQQ very strong and the IWM just starting to break out. On the shorter timeframe the SPY and QQq are overbought and may need a pause, perhaps giving rise to rotation in to the IWM. Use this information as you prepare for the coming week and trad’em well.
DISCLAIMER: The information in this blog post represents my own opinions and does not contain a recommendation for any particular security or investment. I or my affiliates may hold positions or other interests in securities mentioned in the Blog, please see my Disclaimer page for my full disclaimer.
