5 Trade ideas excerpted from the detailed analysis and plan for premium subscribers:
Ally Financial Inc (NYSE:ALLY)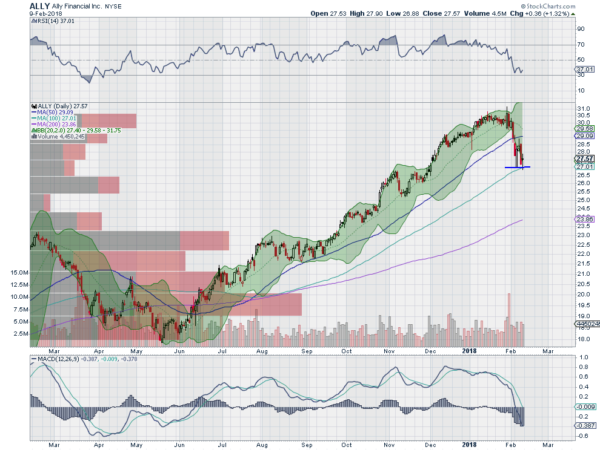
Ally Financial, $ALLY, started higher in May, reaching a top with the market at the end of January. It has pulled back from there, not quite a 38.2% retracement of the move, but to the 100 day SMA, where it is holding. The RSI bottomed and is moving along nearly oversold with the MACD falling and negative. Look for a bounce to participate to the upside…..
Fortinet Inc (NASDAQ:FTNT)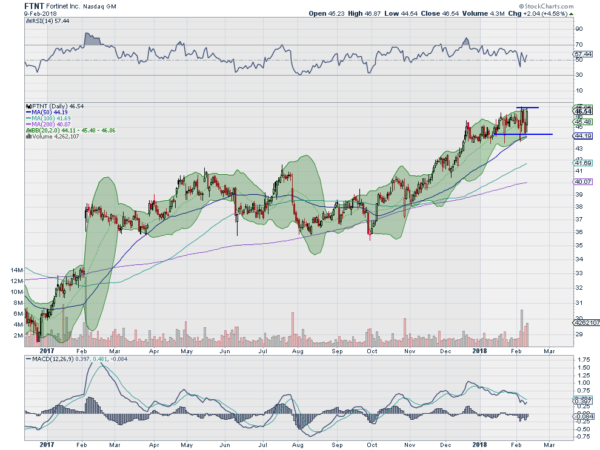
Fortinet, $FTNT, ran along its 200 day SMA from August through to the end of October. That is when it started moving higher. It has paused over the last 6 weeks, holding over support, and allowing the 50 day SMA to catch up. It ended last week at all-time highs with the RSI pushing higher in the bullish zone and the MACD trying to cross up. Look for a new high to participate to the upside…..
WW Grainger Inc (NYSE:GWW)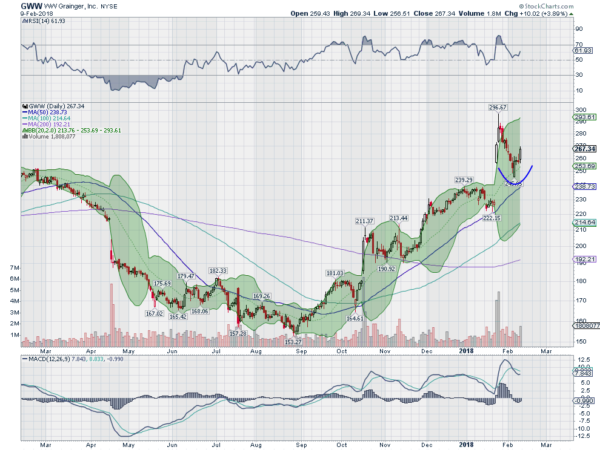
W.W. Grainger, $GWW, started moving higher in September and crossed its 200 day SMA in October. That was followed by a Golden Cross in November and it continued higher. It paused and reconnected with the 50 day SMA in January and then gapped higher to a top at the end of the month. The pullback in a bull flag found a bottom last week and it started back higher Friday. The RSI is moving up in the bullish zone with the MACD curling higher as well. Look for continuation to participate…..
Interactive Brokers Group Inc (NASDAQ:IBKR)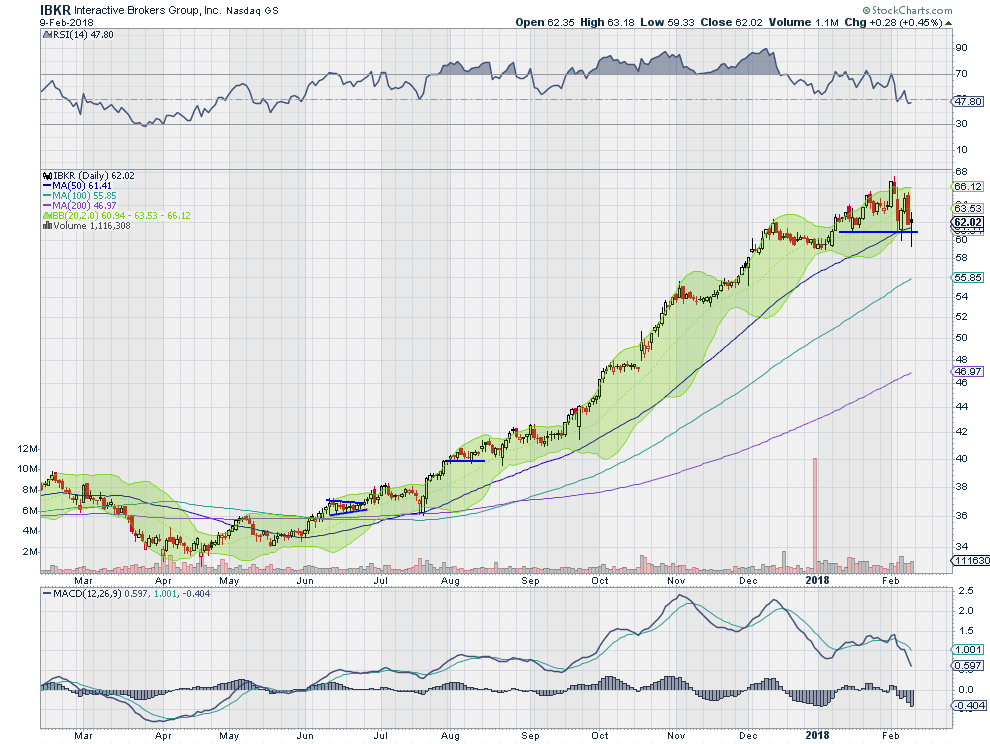
Interactive Brokers, $IBKR, started higher in the summer, breaking over its 200 day SMA in June and then retesting and holding in July. From there it steadily plodded higher until a top at the end of January. It pulled back with the market last week but had good relative strength and held over the 50 day SMA. The RSI is trending lower but in the bullish zone with the MACD falling. Look for the stock to lose support to trade lower…..
Oshkosh Corporation (NYSE:OSK)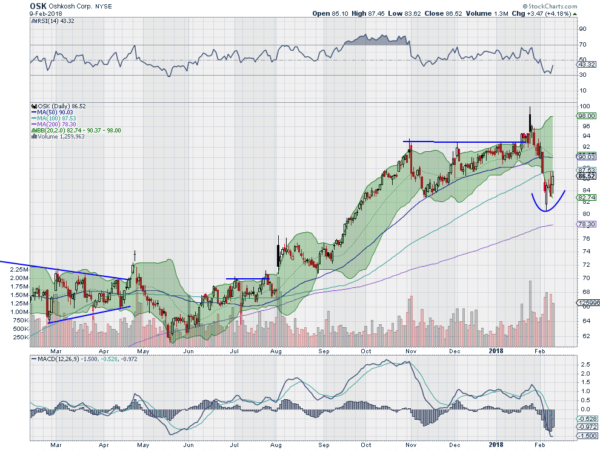
Oshkosh, $OSK, broke above resistance 3 weeks ago and ran higher, only to fail and fall back. Prior resistance did not act as support and the price fell back under the 100 day SMA. It held there until starting higher Friday. The RSI also turned up and the MACD is leveling after falling. Look for continuation to participate higher…..
Up Next: Bonus Idea
After reviewing over 1,000 charts, I have found some good setups for the week. These were selected and should be viewed in the context of the broad Market Macro picture reviewed Friday which heading into February Options Expiration saw the equity markets finally have their first 3%, 5% and 10% pullbacks in a very long time, all in one week.
Elsewhere look for Gold to continue lower while Crude Oil also continues to pullback. The US Dollar Index bounce looks to continue while US Treasuries are biased continue lower. The Shanghai Composite and Emerging Markets are both biased to the downside, but with Emerging Markets at long term support.
Volatility looks to remain elevated keeping the bias lower for the equity index ETF’s SPDR S&P 500 (NYSE:SPY), iShares Russell 2000 (NYSE:IWM) and PowerShares QQQ Trust Series 1 (NASDAQ:QQQ). Their charts incurred major damage in the shorter time frame but all ending with potential reversal candles, awaiting confirmation Monday. The longer timeframes all see major rests to momentum indications and stopped short of any trend change. Use this information as you prepare for the coming week and trad’em well.
DISCLAIMER: The information in this blog post represents my own opinions and does not contain a recommendation for any particular security or investment. I or my affiliates may hold positions or other interests in securities mentioned in the Blog, please see my Disclaimer page for my full disclaimer.
