Index Futures Net Changes and Settlements:

Foreign Markets, Fair Value and Volume:
- In Asia 7 out of 11 markets closed lower: Shanghai Comp -0.16%, Hang Seng +0.24%, Nikkei -0.31%
- In Europe 5 out of 6 OPEN markets are trading higher: CAC CLOSED, DAX CLOSED, FTSE +0.17%
- Fair Value: S&P +0.26, NASDAQ +12.21, Dow -24.71
- Total Volume: 2.0mil ESM, and 1.9k SPM traded in the pit
Today’s Economic Calendar:
Today’s economic calendar includes PMI Manufacturing Index 9:45 AM ET, ISM Mfg Index 10:00 AM ET, Construction Spending 10:00 AM ET, and Neel Kashkari Speaks at 6:00 PM ET.
S&P 500 Futures: Pre-Holiday Rally ‘Short Squeeze’

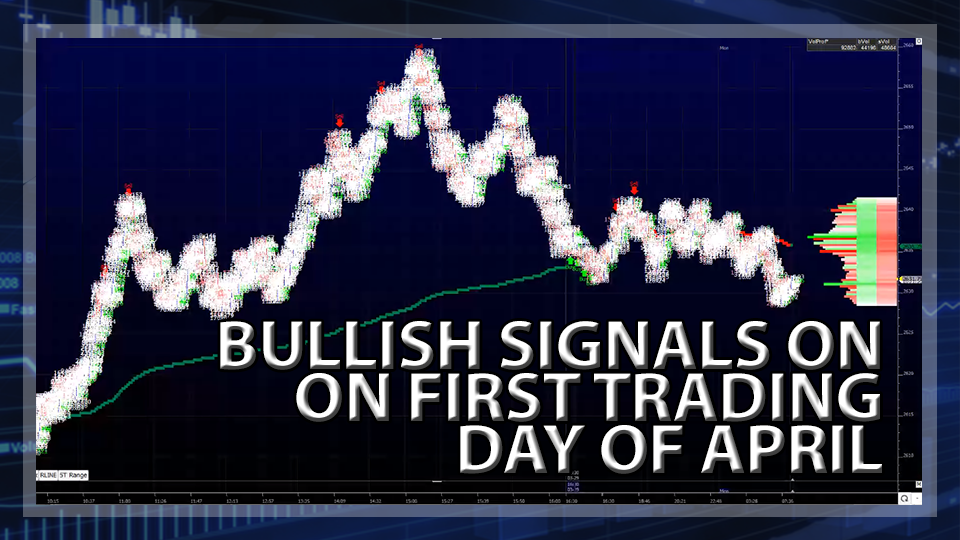
Thursday, the major Asian markets made small gains, and Europes Stoxx 600 was up 0.5%, led by the auto sector. In the U.S., the S&P 500 futures pointed to a 0.40% gain before the day session. On Globex, the ES had an overnight trading range of 2601.00 to 2620.75, with 207,000 contracts traded.
On Thursdays 8:30 futures open, the S&P futures traded 2618.00, made a move up to 2623.75 a few minutes after the bell, and then sold off down to an early low at 2609.25 before going on an upside rampage. By 10:00 the ES had traded all the way up to 2642.00, up 34 handles, or +1.32%.
After the high, the ES sold off 14 handles, down to 2628.00, and then popped back up to 2637.00, before pulling back down to 2627.00. From there, the ES ‘back and filled’ for a few hours, and going into 1:00, rallied up to a new high at 2645.75, 2649.75, and eventually up to 2659.75.
After 2:00, a wave of selling came in, knocking the futures down -19 handles to 2640.75 at 2:37, as the end of the quarter rebalance started to kick into gear. The ES then popped up to 2654.00, traded 2642.50 on the 3:00 cash close, and then 2636.75 on the 3:15 futures close, up +29.25 handles, or up +1.12%. The Nasdaq futures closed up 93.25, or +1.44%.
In the end, bargain hunters snapped up shares of Facebook (NASDAQ:FB), Google (NASDAQ:GOOGL), Nvidia and Amazon (NASDAQ:AMZN), along with other tech names, on the final trading day of the quarter ahead of Good Friday and the Easter holiday.
In Thursday’s Opening Print, I said that I was concerned that if tech stocks sold off the ES could end up taking on its 2587.00 200 day moving average, and also, if the ES get above 2635.00 it could go right to 2660.00. Well, the high ended up being 2659.75. The buying that helped push the ES up most of the day was met with some late day profit taking and end of the quarter rebalance selling.
SocGen Warns of Late-Cycle Volatility Bursts in Months Ahead
By Bloomberg
Joanna Ossinger
April 1, 2018, 11:41 AM EDT
Volatility may be here to stay — but there’s a lot investors can do to prepare for it.
“Hedges against late cycle volatility bursts in credit, dispersion and cross-asset volatility as the equity/bond correlation itself becomes more volatile” are one key theme in Societe Generale (PA:SOGN) SA’s second-quarter outlook from strategists led by Kokou Agbo-Bloua, the firm’s head of flow strategy and solutions. The outlook was published March 30.
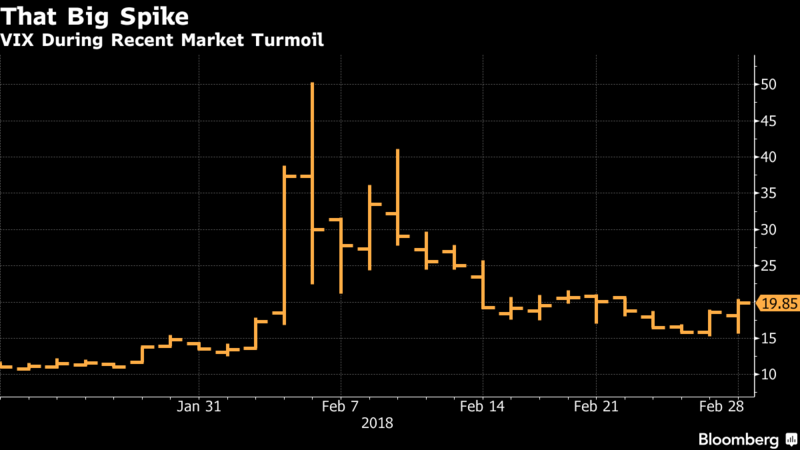
The report, titled “Macro ‘Black Mirror”’ after a U.K. television series that looks at unanticipated consequences of technology, warns that advances such as algorithmic trading are exacerbating trading issues with “profound distortions in market liquidity or the illusion thereof,” citing the volatility spiral in early February as an example.

The strategists also say that 2018 will be the first year since 2009 when net inflows of liquidity provided by all central banks will turn negative, setting the stage for regime change in both correlations and cross-asset volatility and risk premia.
The report’s suggested volatility-related trades include:
- Hedge credit risk with a high-yield basket (SocGen created a basket comprised of about 200 of the most liquid stocks that are among the Markit iBoxx USD Liquid High Yield Index constituents, and is equal-weighted)
- Buy VIX May/June 18/24 calendar strangles; this would capture all the upside in case of another volatility spike and is also long volatility of volatility
- Buy Euro Stoxx 50 Dec. 3700 calls given implied volatility near historical lows
- Buy USD Rates vs S&P/ASX 200 variance spread; SocGen likes buying volatility on U.S. fixed-income amid central-bank policy changes, among other factors, and sees Australian stocks as a good financing leg because superannuation allocation into equities is significant and growing, and miners are far less levered now
Disclaimer: Trading Futures, Options on Futures, and retail off-exchange foreign currency transactions involves substantial risk of loss and is not suitable for all investors. You should carefully consider whether trading is suitable for you in light of your circumstances, knowledge, and financial resources. Any decision to purchase or sell as a result of the opinions expressed in the forum will be the full responsibility of the person(s) authorizing such transaction(s). BE ADVISED TO ALWAYS USE PROTECTIVE STOP LOSSES AND ALLOW FOR SLIPPAGE TO MANAGE YOUR TRADE(S) AS AN INVESTOR COULD LOSE ALL OR MORE THAN THEIR INITIAL INVESTMENT. PAST PERFORMANCE IS NOT INDICATIVE OF FUTURE RESULTS.
