The big market move wasn’t the only rare image captured in October…
because that was a massive rally from the end of September. If you were running a fixed stock/bond allocation model that rotated at month end, pat yourself on the back. Trend followers had a different experience as many were moving bonds, stocks and currencies as a result of short to intermediate trends shifting from one direction to the other. Now the question is whether or not this counter-trend rally has finished. Do the Central Banks still have some more liquor in the cabinet or have their bottles run dry? And can the global economy stay out of the danger zone if commodities and credit continue to deteriorate? Earnings made it through the gauntlet this Q3, but will they stand up to another move higher in the U.S. dollar or bout of weakness in China? It still seems prudent to play things safe going into year-end, but combine the seasonality factor with Central Bank joyfulness and who knows how high this rocket powered market can move into 2016. Watch credit spreads, watch commodity prices and watch market breadth as they will help with our answers.
Last week it was the U.S. Central Bank’s turn to spark the markets higher…
The market liked the removal of the “global” worry sentence as well as their notice to look again at raising rates in December. So the hawks were thrown a dove wing. Now will the U.S. data be able to string together numbers strong enough for the Fed to move before Santa arrives?
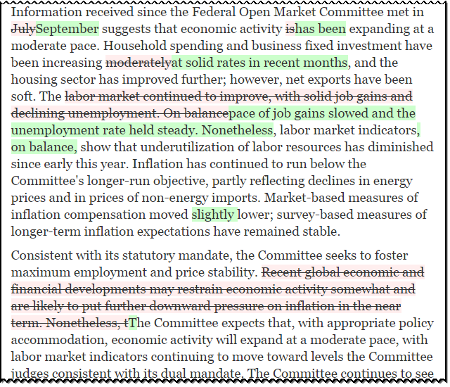
Just like they said…
@TheStalwart: “The onus is now on the data to disappoint to prevent a December hike.” — Deutsche Bank (DE:DBKGn)
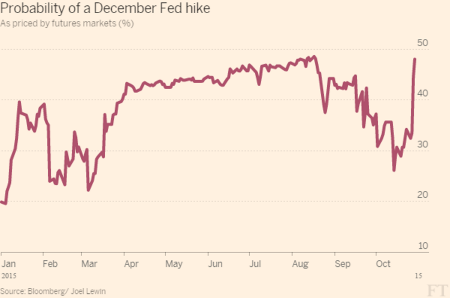
The market adjusted its chips quickly to make the December meeting a coin flip for lift-off…
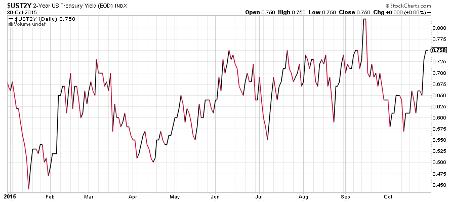
Meanwhile, the 2 year Treasury rate returned to its 2015 highs, further sparking the markets and brokerage stocks…
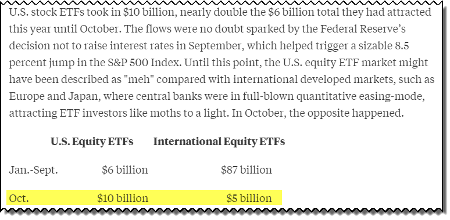
As money left the short end of the curve, many rushed into Equities…
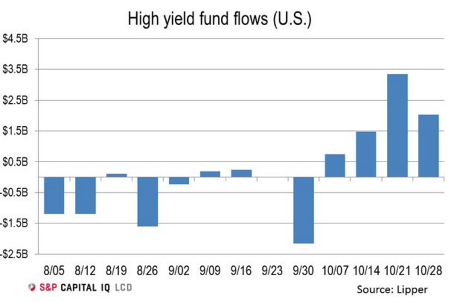
Even Junk Bonds (N:JNK) saw a return of flows…
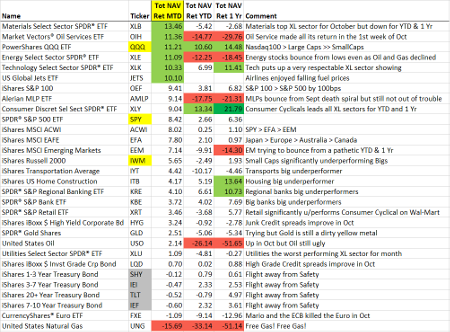
Looking at October’s performance showed a significant reversion to the mean with many of the worst assets performing the best…
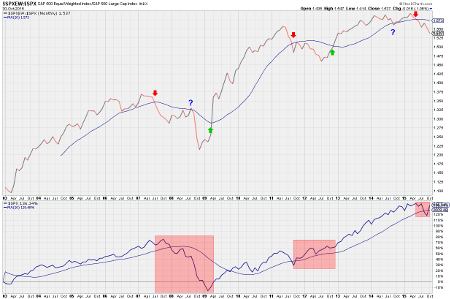
But while Equities sprinted back towards their highs, not all stocks participated. Super Caps led the drive higher while Smaller Caps lagged…
For the 1st time in a year, the S&P 500 pushed through its upper two standard deviation band of its 50-day trading range…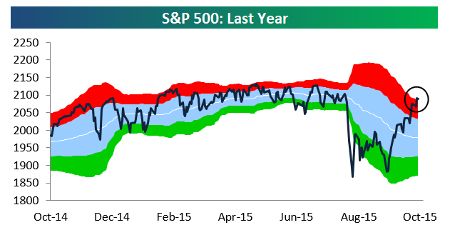
(Bespoke)
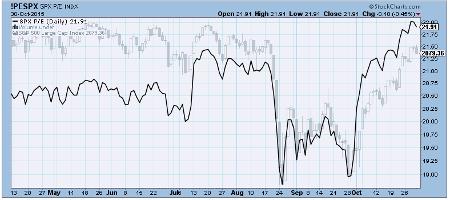
And with the gain in prices and its falling earnings, the S&P 500 P/E has quickly jumped three multiple points…
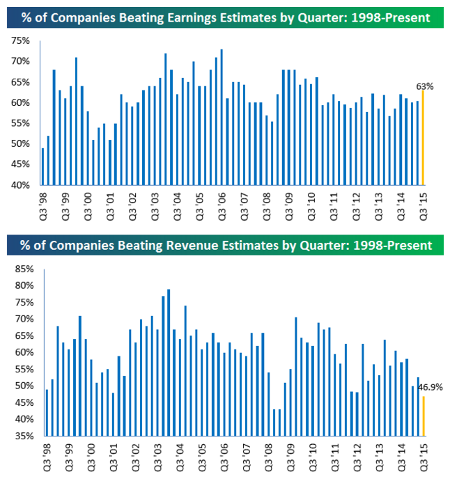
With >75% of the S&P 500 now reporting Q3 numbers, a solid look at the reporting season is coming into focus…
Revenues have come in light all month as the U.S. dollar and weaker Local, International, Energy and Industrial sales hit. But helped by the later Technology reports, Earnings are looking like they will finish better than expected at the highest level since 2010…
(Bespoke)
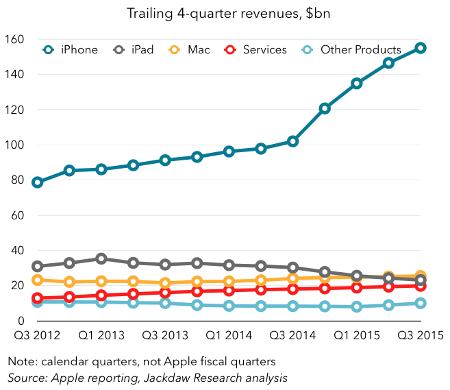
The giant Apple (O:AAPL) reported last week. If they could only come up with another leg of revenue growth away from the Smartphone, the stock would really leg higher…
@jandawson: Stark reminder of how much Apple has an iPhone business, and then everything else…
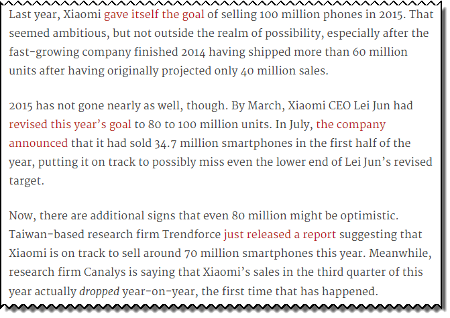
Maybe due to Apple, a top Unicorn’s horn is wilting…
Starbucks (O:SBUX) had a solid quarter, but like many Consumer brands, China was the ball and chain…
Starbucks: The news accompanied a better-than-expected 8 per cent jump in fiscal fourth-quarter same-store sales. Sales were driven by a 4 per cent rise in store traffic. Same-store sales in China and Asia-Pacific, however, disappointed, rising 6 per cent. That came in below forecasts for 9.6 per cent growth.
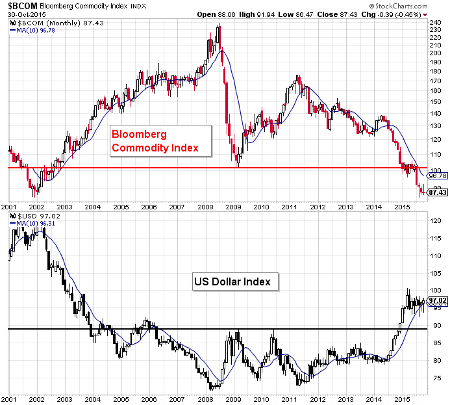
Commodities remain weak across all assets not because of China and the EMs, but also due to the (again) rising U.S. dollar…
If the dollar’s move is not measured, commodities could be a major leg of the market stool to get cut off.
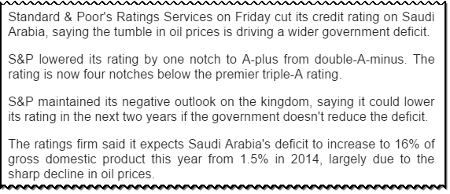
As oil prices continue to fall, so do the economies of oil producing nations…
Could someone please send FIFA a chart of crude oil prices?
(@know)
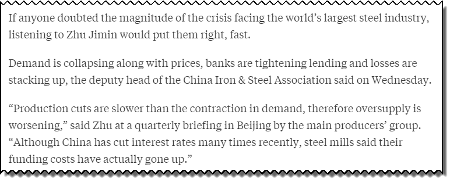
In China, their steel mills make up 50% of global output. The steel companies are not doing well…
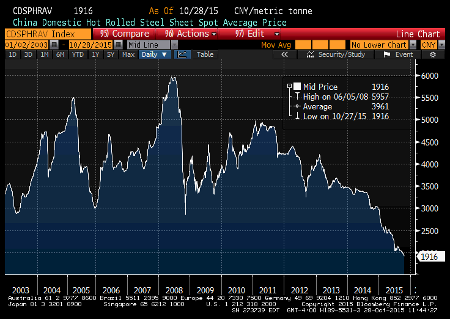
Just look at Chinese steel prices for confirmation…
@DividendMaster: it's your daily reminder steel prices fell again last night to new 21st century lows in China. Exported everywhere
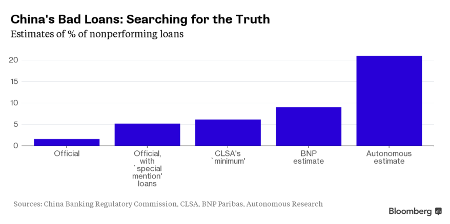
Note to self, don’t trust Chinese credit data…

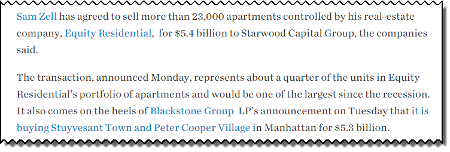
As for Real Estate, when Sam Zell is selling assets to pay a special dividend (rather than reinvest), you had best pay attention…
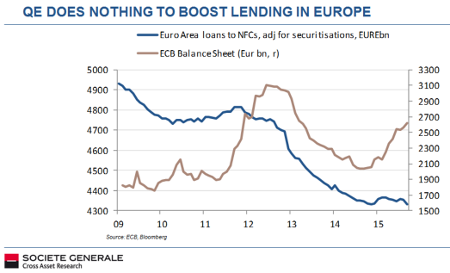
Interesting that incredible ECB easing is having little effect on companies leveraging up…
“Corporate behaviour has been paradoxical given the backdrop of so much central bank support in Europe: companies are deleveraging, not releveraging, and are buying back bonds not stock. Corporate “animal spirits” have yet to be unleashed. But consumer behaviour seems to be mimicking this too. While negative interest rate policies across Switzerland, Denmark and Sweden are supporting asset prices such as housing, household savings rates in these countries have also been rising.”
(BAML)
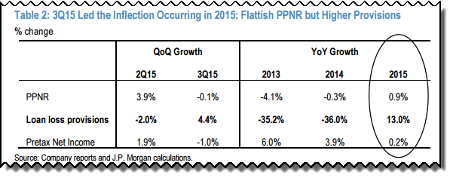
JPMorgan's (N:JPM) analysis of big U.S. bank Loan Loss Provisions was worrying to me…
After years of declines, the banks are now adding to reserves. Big losses may be years away, but the change in direction is important to take note of.
Also to note is that J. Crew elected on Friday to pay its bondholders in more paper rather than in cash…
Better take a look at the stock chart of Gap Stores (N:GPS) to confirm how the industry is doing.

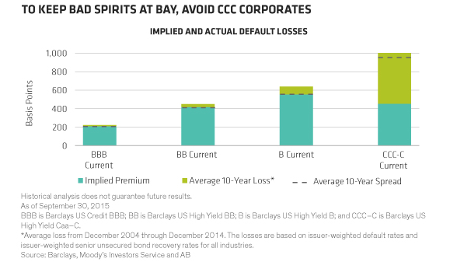
Speaking of CCC rated paper, interesting piece from Alliance Bernstein telling you to avoid the CCC credits. Better values in junk paper starting with a B…

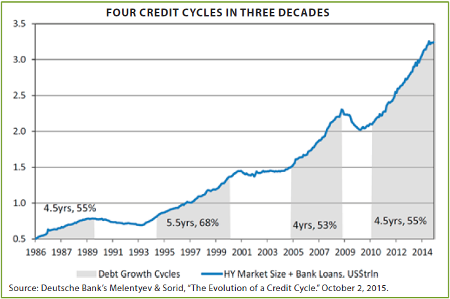
More on Credit… What a great chart. Keep an eye on those expansions. How much longer can credit run?
(@EvergreenGK)
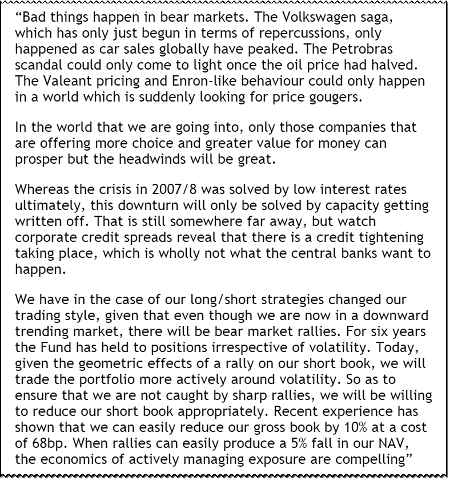
Worthwhile thoughts from Crispin Odey writing about the next downturn…
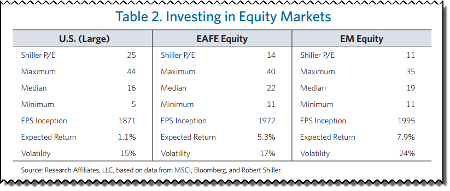
Like GMO, the team at Research Affiliates is also looking to EM to harvest their future returns…
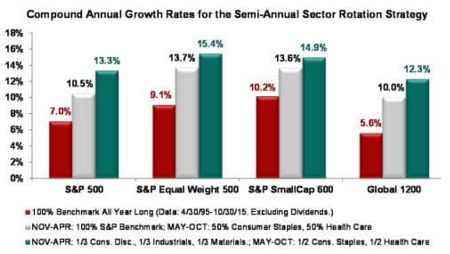
Over at S&P Capital IQ, Sam Stovall shows you a simple idea to try and beat the Markets…
The investor could use the same half-and-half holding of consumer staples and healthcare in May through October, but then buy a one-third exposure to the consumer discretionary, industrials and materials sectors from November through April. The latter group is made up of cyclical stocks – ones that are expected to more closely track economic performance. In this case, the investor would see a gain of 13.4 per cent, and have topped the market 71 per cent of the time. The conclusions held up not only with the S&P 500, but with several other indexes, such as the S&P SmallCap 600, and S&P Global 1200, according to Mr. Stovall.
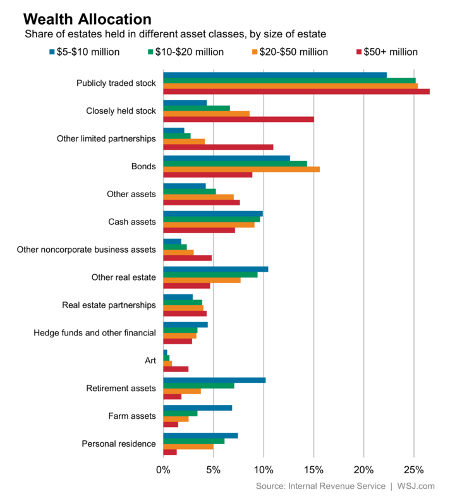
Note the abundance of Public, Private, and LP Equity in the estates of the wealthy. They are not leaving planet Earth with a bulk of bonds in the portfolio…
The information presented here is for informational purposes only, and this document is not to be construed as an offer to sell, or the solicitation of an offer to buy, securities. Some investments are not suitable for all investors, and there can be no assurance that any investment strategy will be successful. The hyperlinks included in this message provide direct access to other Internet resources, including Web sites. While we believe this information to be from reliable sources, 361 Capital is not responsible for the accuracy or content of information contained in these sites. Although we make every effort to ensure these links are accurate, up to date and relevant, we cannot take responsibility for pages maintained by external providers. The views expressed by these external providers on their own Web pages or on external sites they link to are not necessarily those of 361 Capital.
