February Bumps
With January now behind us, and as the luster of the election begins to fade, the question becomes what will the month of February bring. While it is impossible to predict outcomes with absolute certainly, we can look at historical precedents to discern the risk that we undertake as investors.
If we look at the month of February going back to 1960 we find that there is a slight bias to February ending positively 57% of the time.
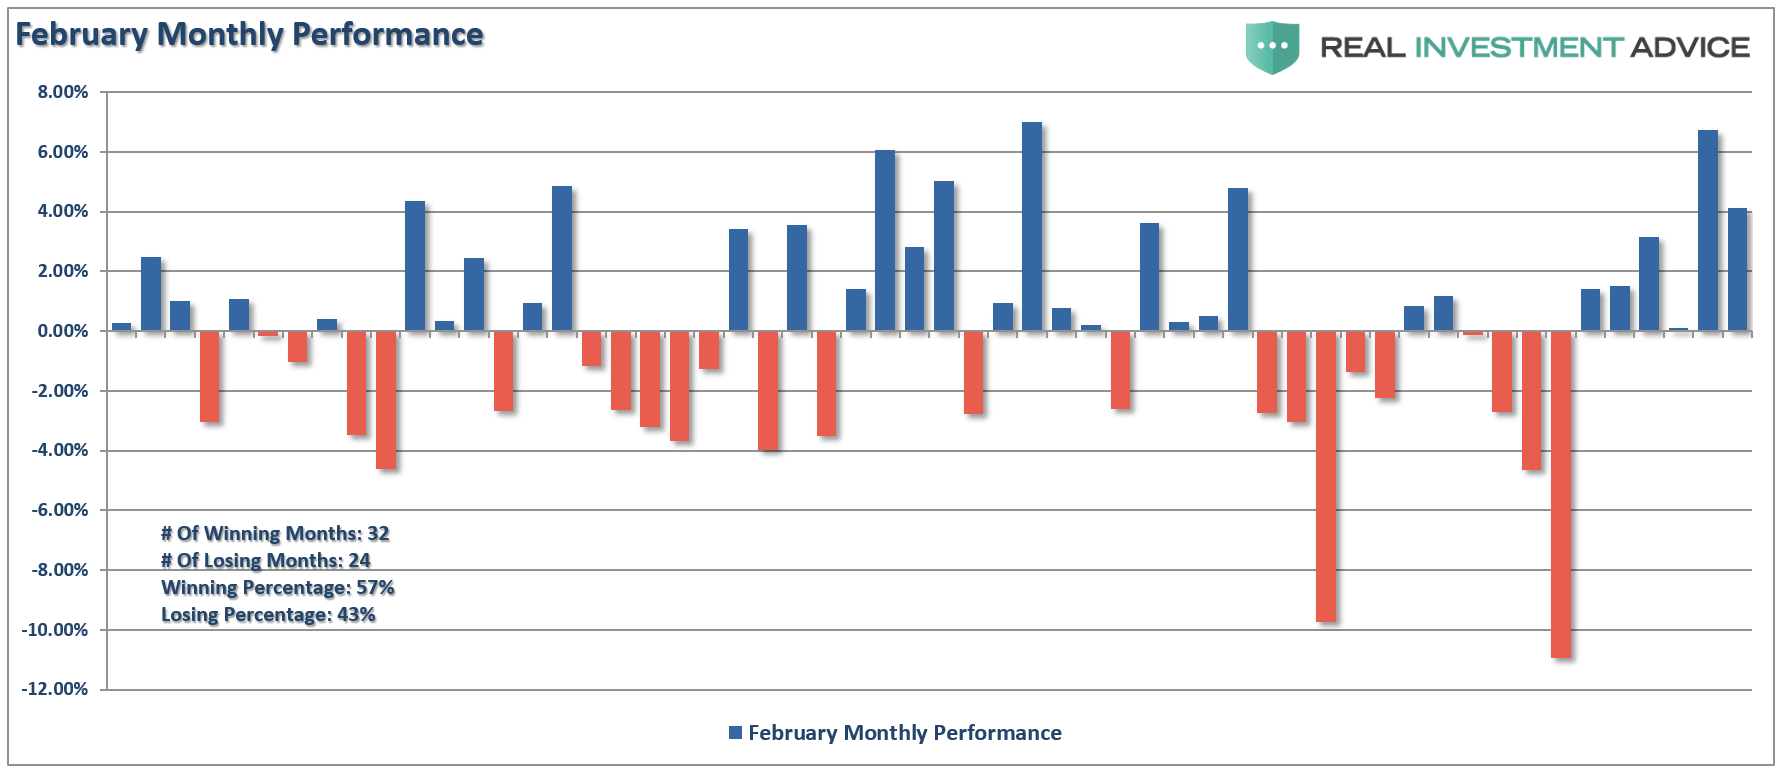
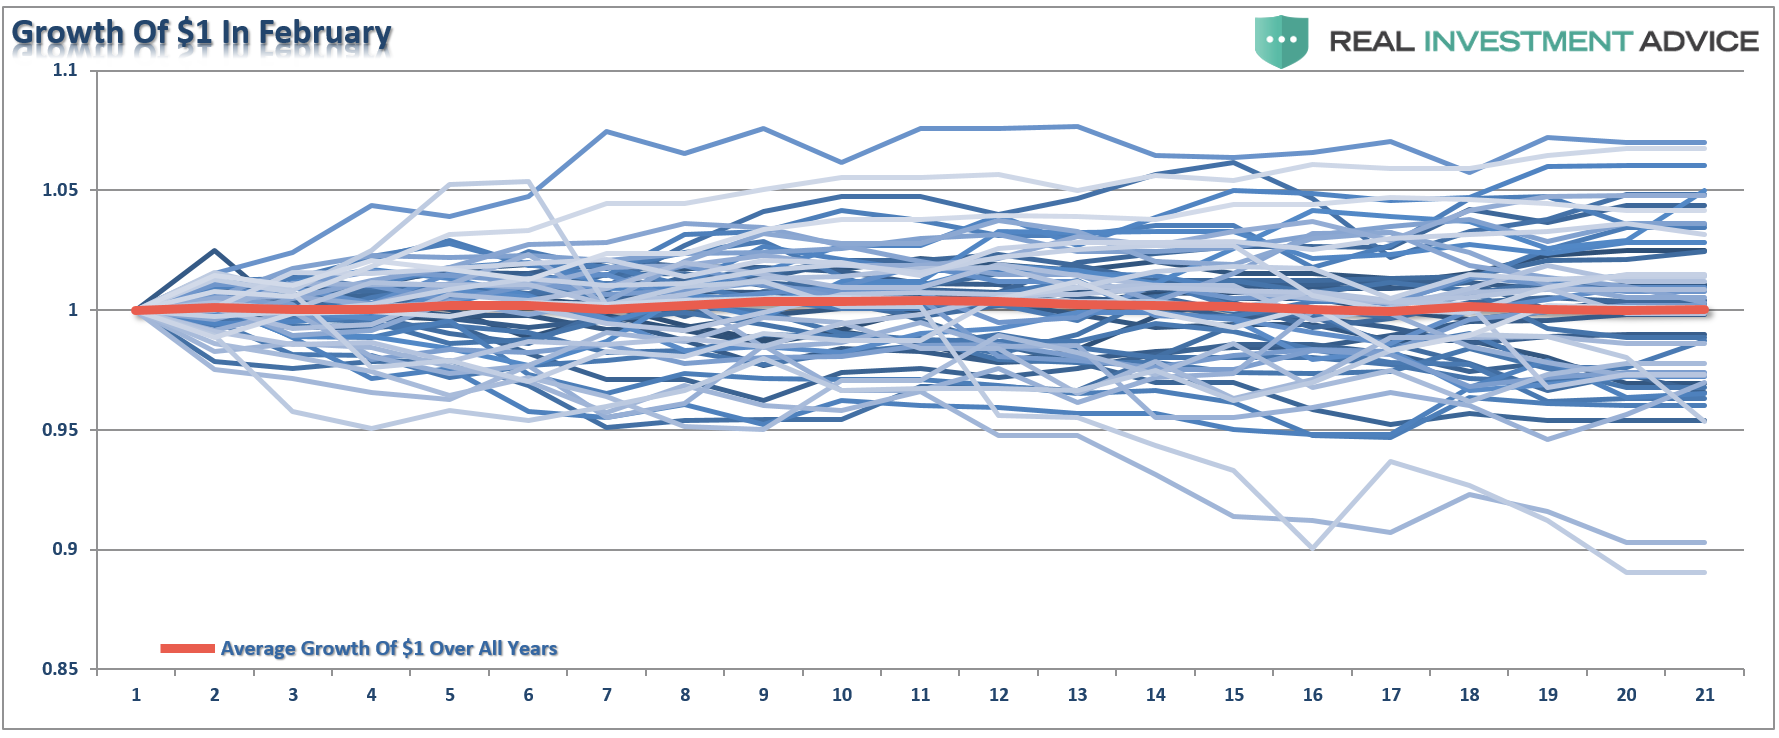
Unfortunately, the declines in losing months have wiped out the gains in the positive months leaving the average return for February almost a draw (+.01%)
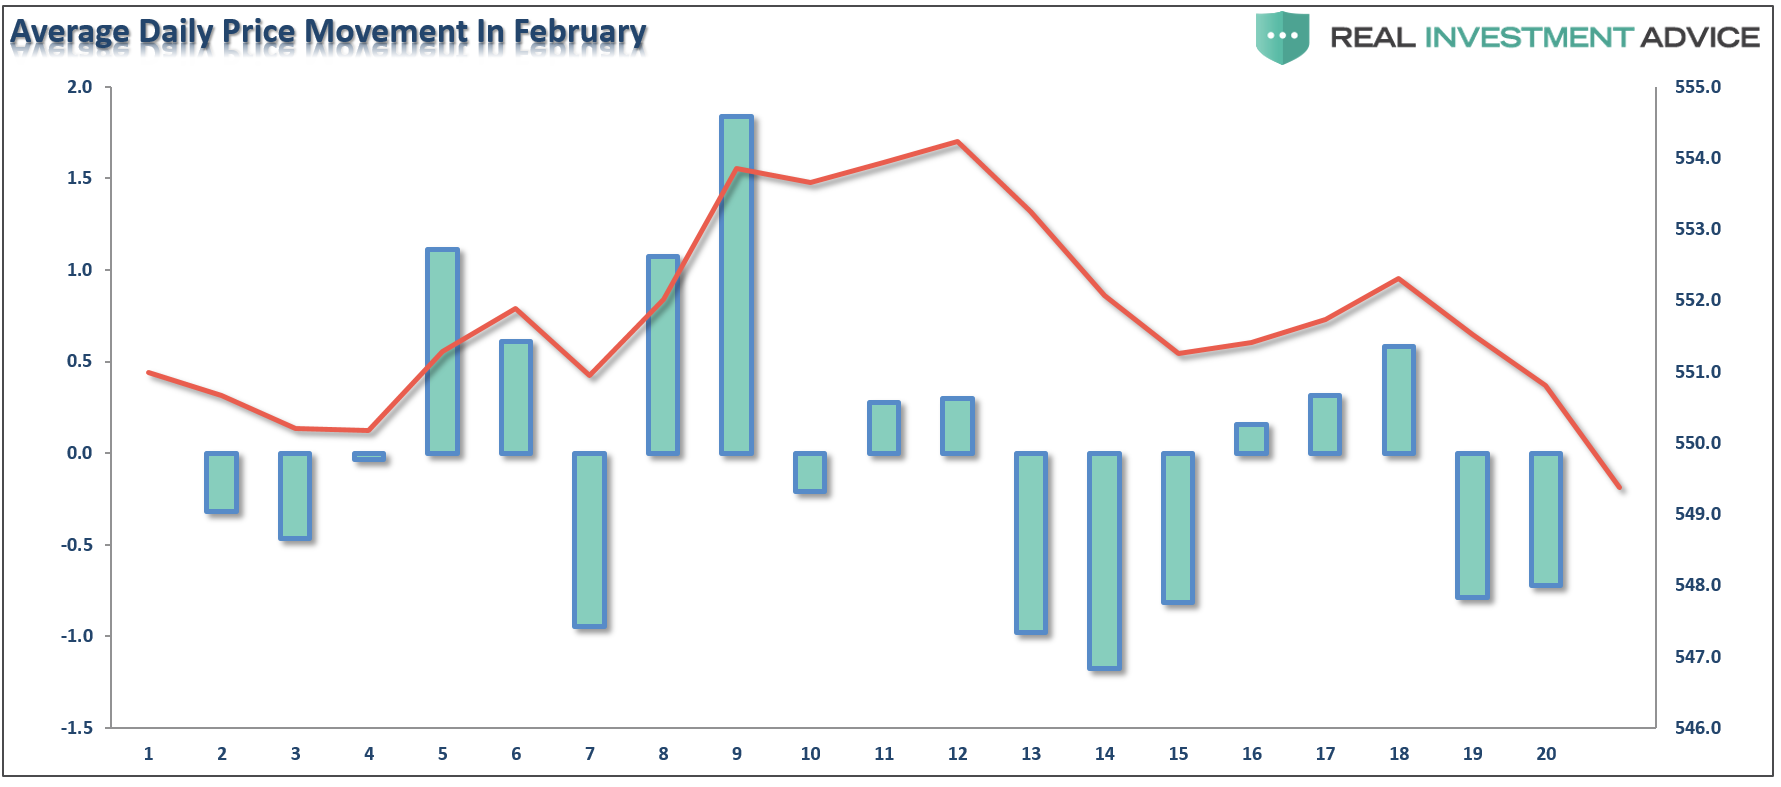
A look at daily price movements during the month, on average, reveal the 4th trading day of February through the 12th day provide the best opportunity to rebalance portfolio allocations and reduce overall portfolio risk.
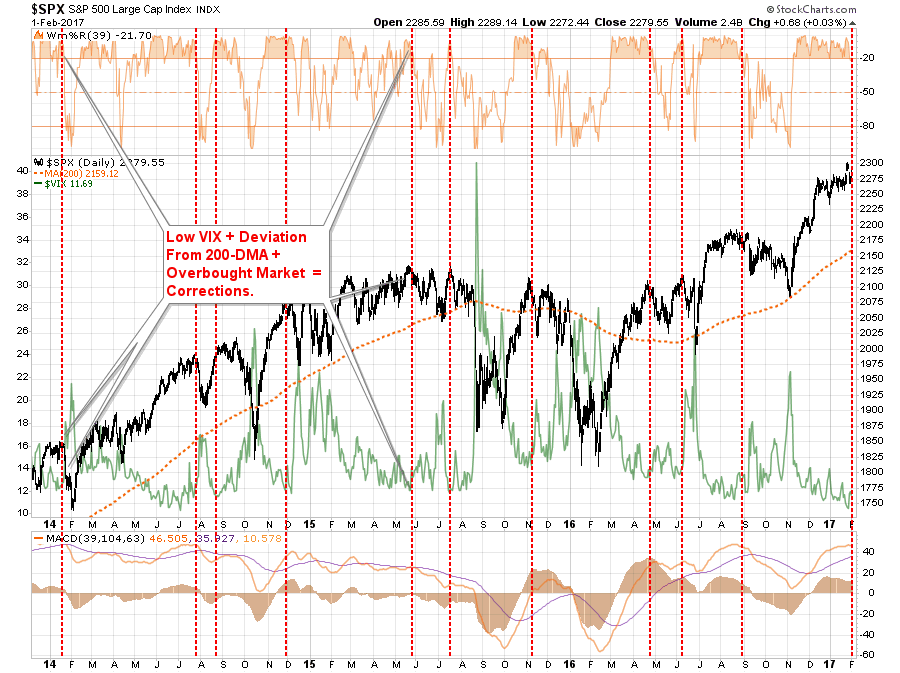
Currently, bullish exuberance is once again pushing extremely high levels. As noted yesterday:
Historically, the combination of excessive exuberance, complacency and extensions have not worked out well for investors in the short-term.
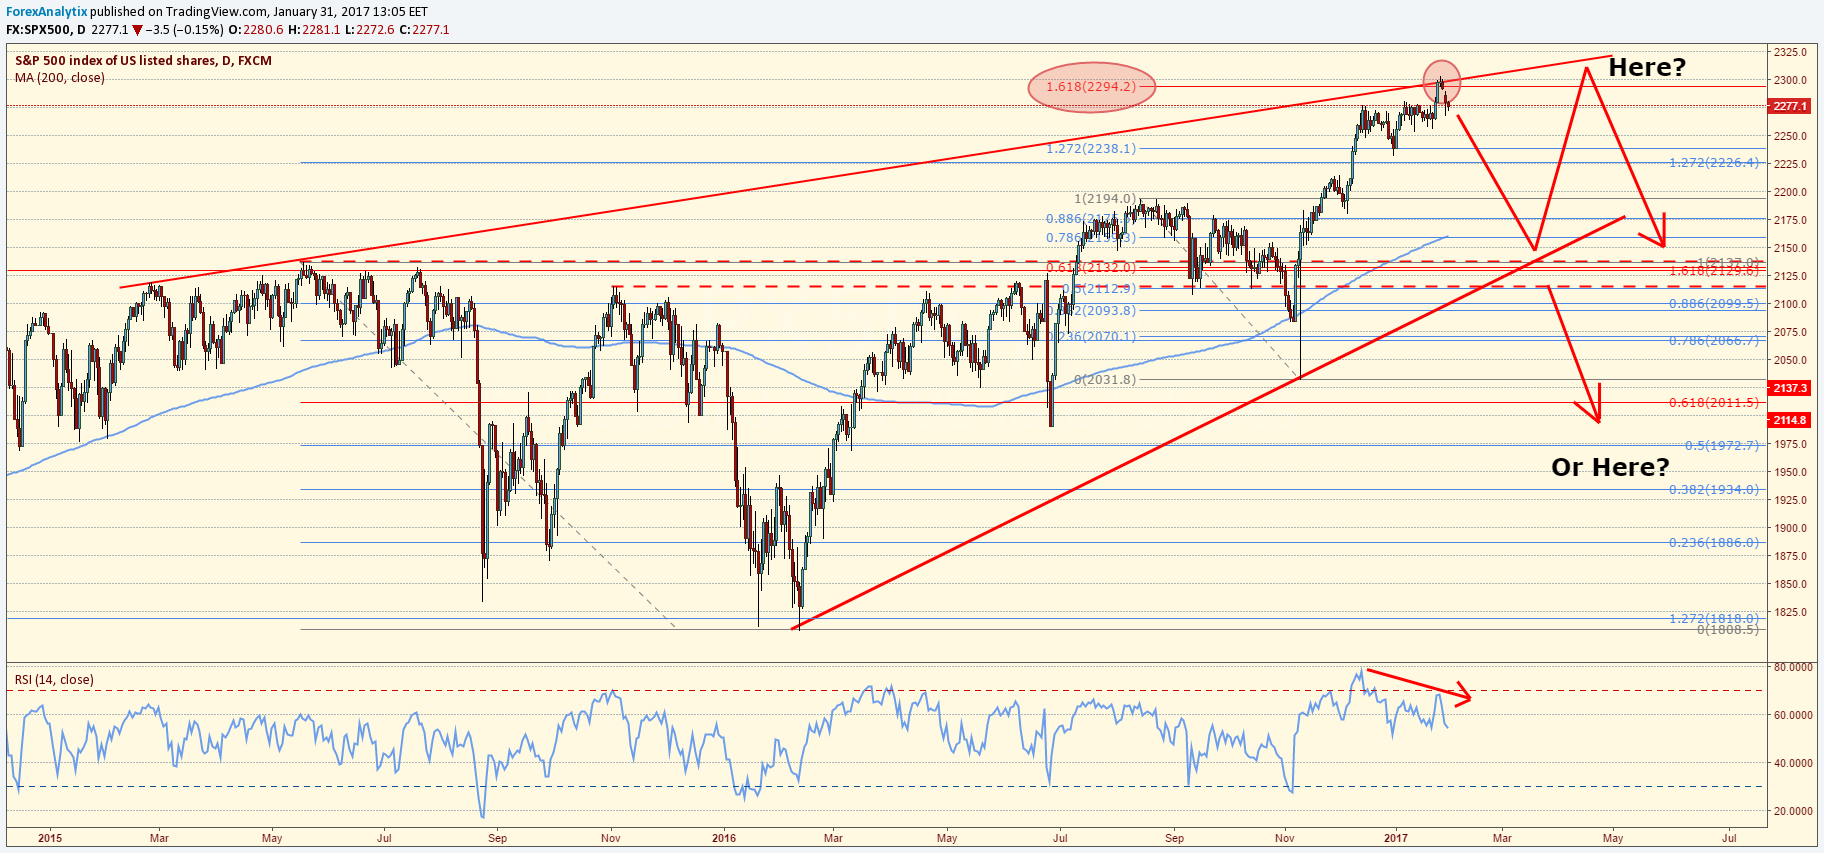
Furthermore, Blake Morrow at Forex Analytix made an interesting point as well:
We have been making higher highs and higher lows (the definition of an uptrend). However, the rate that the higher highs are happening is lower than that of the higher lows. From this, it follows that we may be developing an ascending wedge. Also, the apex is not as tight in price that I typically like for a reversal pattern.
The animal spirits of the Trump presidency cannot be denied, however, when price exceeds action, or perhaps when it lies way ahead of expectations, the risk for failure in price is quite high. In other words, has price exceeded expectations of the new US administration? Perhaps. Or perhaps the new administration’s risk of not meeting current (high) expectations of the market is also very high, which could allow for a pullback in the broad markets.
There is sufficient evidence to warrant a continued review of portfolio positioning and reduce risk by:
- Raising cash by reducing overall exposure, or
- Adding positions that will hedge against a market decline, or
- Some of both
Taking some action now will likely pay off in the not too distant future. If I am wrong, then you simply rebalance your portfolio, increase risk and enjoy the ride..
But if I am right, the reduction in the negative impact caused by capital destruction will be in your favor.
In either case, taking some action at your leisure now is far more advantageous than “panic-selling” when things go dramatically worse than you had planned.
The Fed Is Screwed
The Fed made a critical error yesterday by NOT raising rates.
Employment gains were up in the ADP report, sentiment and “soft survey” manufacturing data is hitting the highest levels in years, and the markets are near all-time highs.
If there was ever a time to lift rates, Wednesday was it.
While the FOMC has talked a narrative of normalizing interest rates and pointing to metrics such as the unemployment and inflation rates, the focus has remained maintaining the level of asset prices to support the wealth effect.
Whether it was the early 2016 plunge where Yellen jumped on the phone with BOE and ECB to make sure liquidity was available, the “Brexit” liquidity push or the perfectly timed “reinvestment” of bond proceeds following the Trump election, the Fed remains ever vigilant.
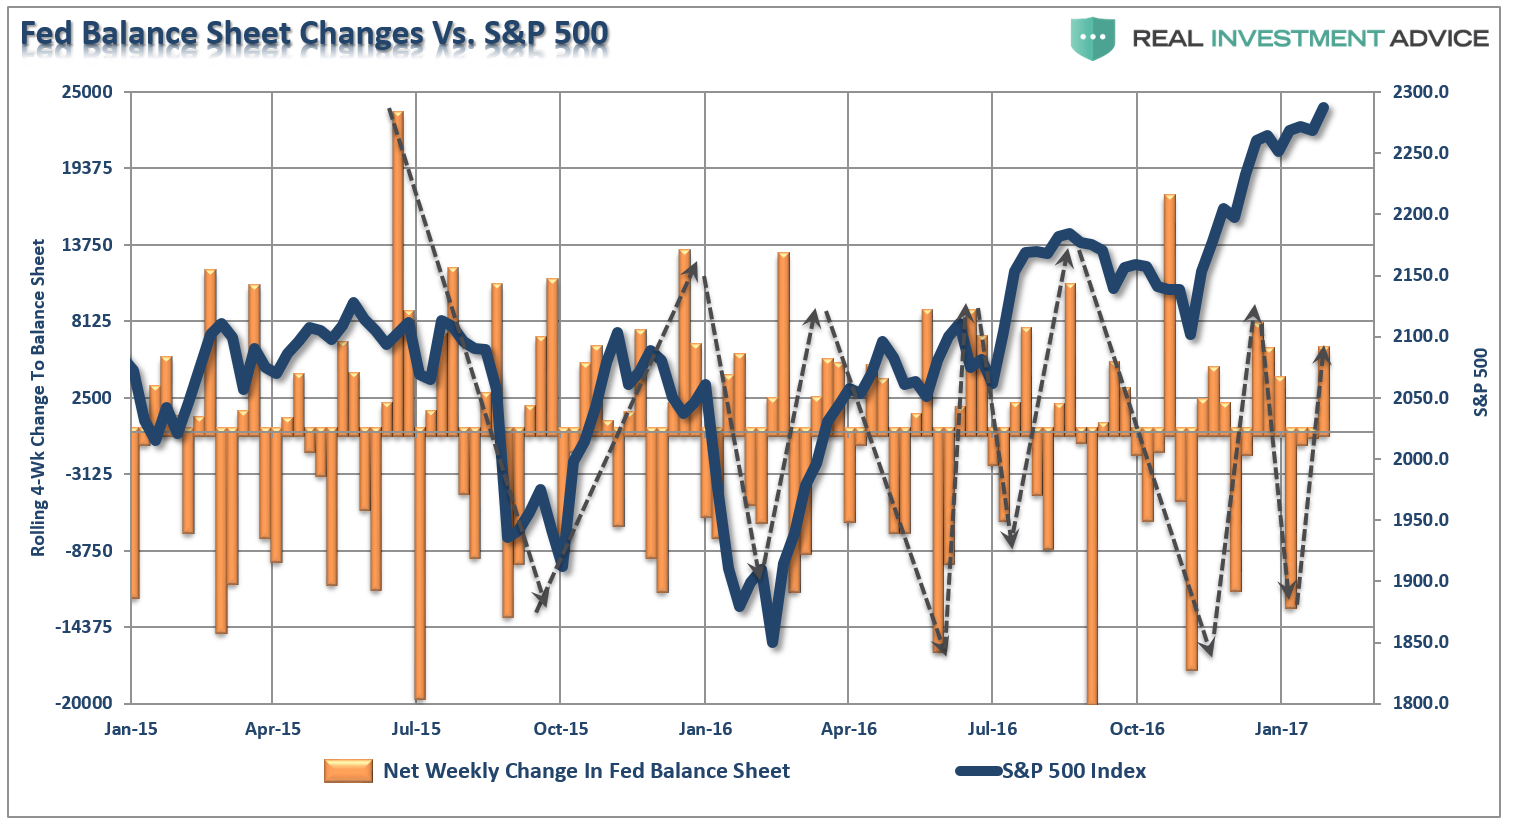
As I wrote previously, I think the Fed is making a major policy mistake.
First, with the markets making new all-time highs, there is a ‘price’ cushion available for the markets to absorb a rate hike without breaking important downside support.
Secondly, with Central Banks globally flooding the markets with liquidity, a further ‘shock absorber’ is currently engaged in softening the impact of a rate hike.
Lastly, the economy is likely going to show a bit of ‘strength’ in upcoming reports, with slightly stronger inflationary pressures. This pickup in economic strength will be another inventory restocking cycle following several months of weakness. As has been in the past, it will be transient and that strength will evaporate as quickly as it came.
If I was Janet Yellen, I would hike interest rates by .50 bps immediately in a surprise announcement and use the price and Central Bank liquidity cushions to soften the blow. This would move the Fed towards its goal of reloading its primary policy tool while there is some ability to temporarily control the outcome of the rate hike.
But that is just me. She won’t do it.
Technically, a correction due to a surprise rate hike might sting a bit but would likely remain well within the confines of a “bull market correction” as shown below. The previous two corrections, leading up to and following the last Fed hike, were between 10-11%. I have noted a correction potential from a rate hike to the bottom of the current Bollinger® band range which would be roughly 10%.
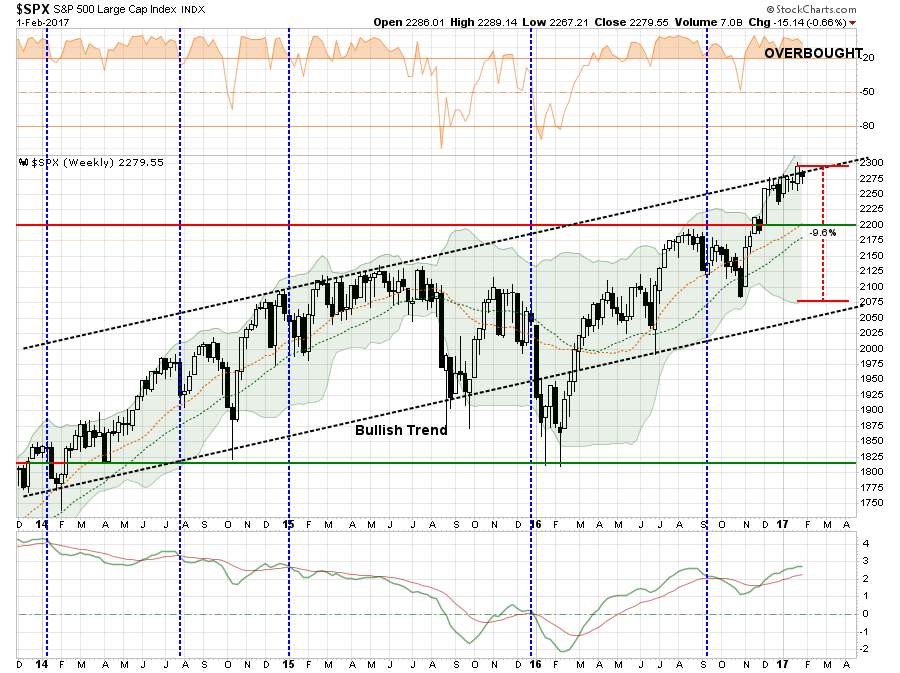
My point, as stated above, is the Fed is likely missing a significant opportunity to use the market’s current “exuberance” to achieve two goals.
- Hike rates to catch up with LIBOR, which is already tightening monetary policy, and;
- Reduce some of the exuberance in the markets which the Fed is now concerned with.
… during the discussion, several participants commented on a few developments, including potential overvaluation in the market for CRE, the elevated level of equity values relative to expected earnings, and the incentives for investors to reach for yield in an environment of continued low interest rates.
They may regret not hiking rates this week.
A 50-70% Correction? Really?
As I was catching up on my reading this morning, two articles came across my email with readers frantically asking me how realistic these predictions could be.
The first was from John Hussman via Hussman Funds discussing valuation:
On the basis of capitalization-weighted indices, historically-reliable valuation measures now approach those observed at the 2000 bubble peak. Yet even this comparison overlooks the fact that in 2000, the overvaluation featured a subset of very large-capitalization stocks that were breathtakingly overvalued, while most stocks were more reasonably valued. In many ways, the current speculative episode is worse, because it has extended to virtually all risk-assets.
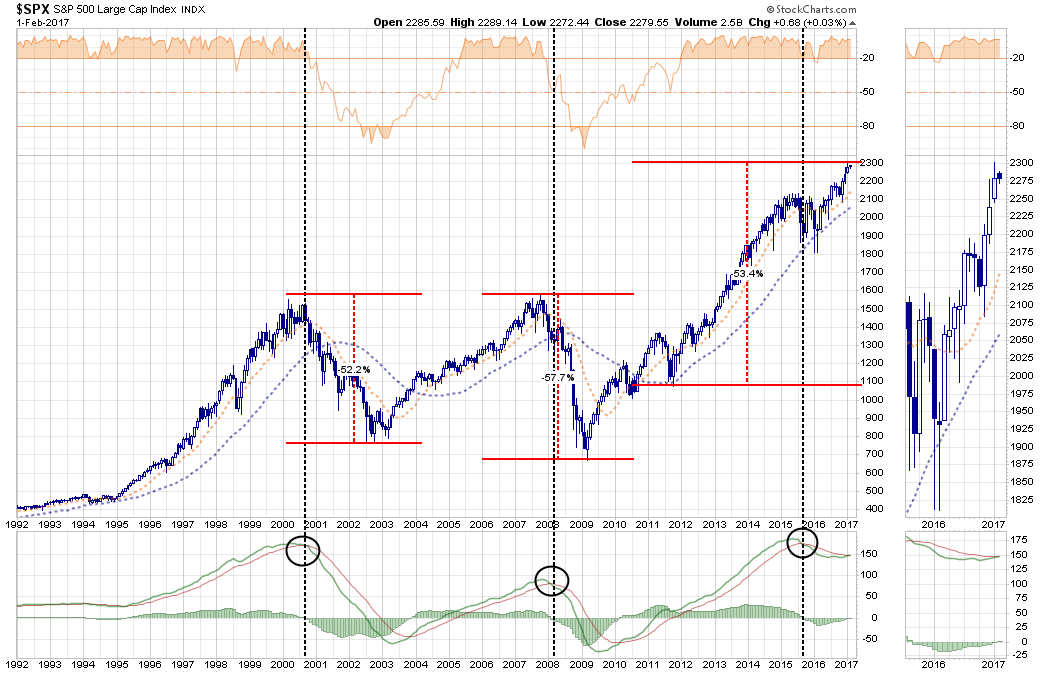
To offer some idea of the precipice the market has reached, the chart below shows the median price/revenue ratio of individual S&P 500 component stocks. This median now stands just over 2.45, easily the highest level in history. The chart presents data since 1986. The longer-term norm for the S&P 500 price/revenue ratio is less than 1.0. Even a retreat to 1.3, which we’ve observed at many points even in recent cycles, would take the stock market to nearly half of present levels.
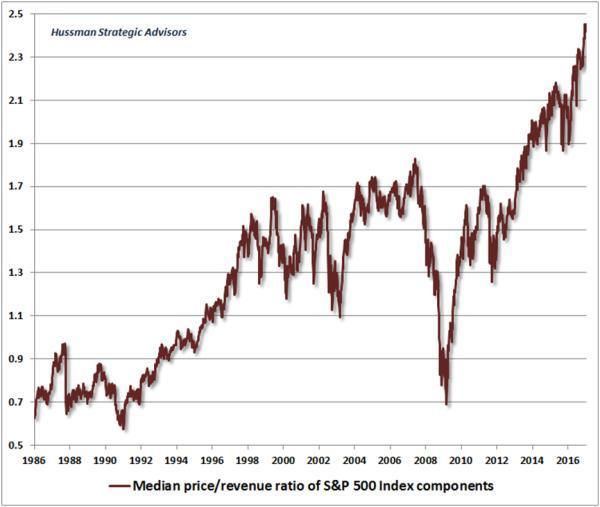
So, a 50% correction from current levels to reset valuations. Historically speaking that would be no worse than the last two bear markets.
But then there is Harry Dent with this:
All four of the cycles I track point down now. One after the next has peaked in the last several years. All four point down into early 2020 or so. That’s only happened in the early to mid-’70s when we had the worst stock crashes back then, the OPEC embargo, etc — the worst set of crises since the 1930s.
The next three years are likely to be the worst we see in our lifetimes. It will be more like the early 1930s when stocks hit a debt bubble and financial asset bubbles crashed, which they only do once in a lifetime such as the early 1930s. Stocks will be down 70, 80, 90% –– that’s to be as expected in this stage of the cycle after such a bubble.
I went from being the most bullish economist in the ’80s and ’90s to now being of the most bearish because what goes up goes down. That’s what cycles do. At heart, I’m a cycle guy. Demographics just happens to be the most important cycle in this modern era since the middle class only formed recently — its only been since World War 2 that the everyday person mattered so much; because now they have $50,000-$60,000 in income and can buy homes over 30 years and borrow a lot of money. This was not the case before the Great Depression and World War 2.
And based on demographics, we predicted that the U.S. Baby Boom wouldn’t peak until 2007, and then our economy will weaken — as both did in 2008. We’ve lived off of QE every since.
And you thought I was bearish.
How accurate are these views? I would suggest the reality lies somewhere between the two.
The problem, as always, remains the timing.
For now, bullish exuberance is in full swing. As is always the case in late-stage bull markets. However, there is very little that President Trump can do to change the tide of the structural and demographic shift that has overtaken the economy. The hopes of a return to 4% economic growth is just that – “hope.”
As John concludes:
The problem our nation faces is a serious one. We have now paired a massive speculative bubble with an errant pin that has every prospect of creating disruption. A steep financial retreat was already baked in the cake prior to the election. My concern is that having reached this precipice, there are few policies that have the capacity to make the consequences substantially better, but many that could make the outcomes substantially worse.
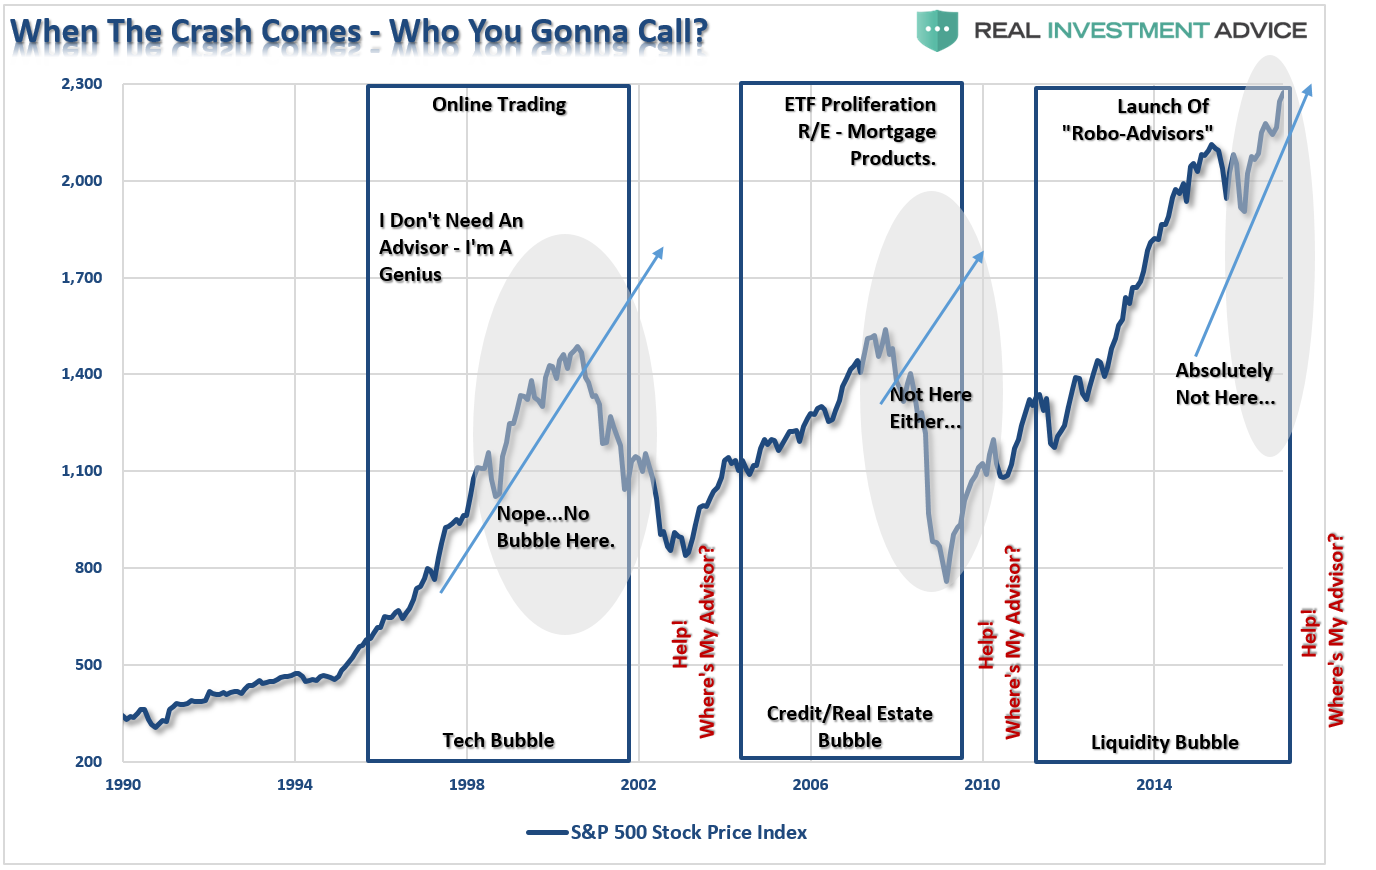
While much of the mainstream media continues to “poo-poo” active managers in favor of “passive indexing,” when the completion of the full-market cycle begins the value of having an astute advisor versus 1-800-Robo-Advisor will become readily apparent.
Just some things I am thinking about.
