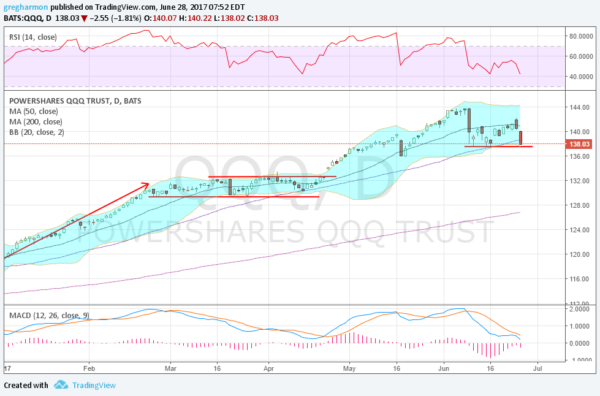
Tuesday the NASDAQ 100 (via NASDAQ:QQQ) closed below its 50 day SMA for the first time in 2017. The tone of traders, investors and pundits changed quickly. My social media streams became flooded with talk of a major top and correction that is underway. That may be but I think it is a bit premature at this point. There was not the same signs of danger from the S&P 500 or the Russell 2000.
Is this just quarter end profit taking in a sector that has been red hot, or something more? There are 3 things to watch in the short run to help figure this out. The chart below shows what is important, price, and uses the NASDAQ 100 ETF. Before we get to those 3 things, note that although this is the first close under the 50 day SMA, it got really close before, less than 10 cents away, in April. That resulted in a big move higher.

But what about the risk side? Starting at the top, the momentum indicator RSI, is falling. It remains in the bullish zone though, over 40,. A move below 40 would give a first clue of more downside. Second is the price action itself. As of Tuesday the price had pulled back less than 5%. It was also sitting over prior support from the first move lower in June. A break below would be a second signal that more downside may be coming.
Finally the MACD at the bottom of the page, another momentum indicator, has been falling. It turned back lower Tuesday avoiding a positive cross. But it remains in positive territory. A break below zero would be the third signal. Watch for these signals to gauge the strength of any further move lower.
DISCLAIMER: The information in this blog post represents my own opinions and does not contain a recommendation for any particular security or investment. I or my affiliates may hold positions or other interests in securities mentioned in the Blog, please see my Disclaimer page for my full disclaimer.
