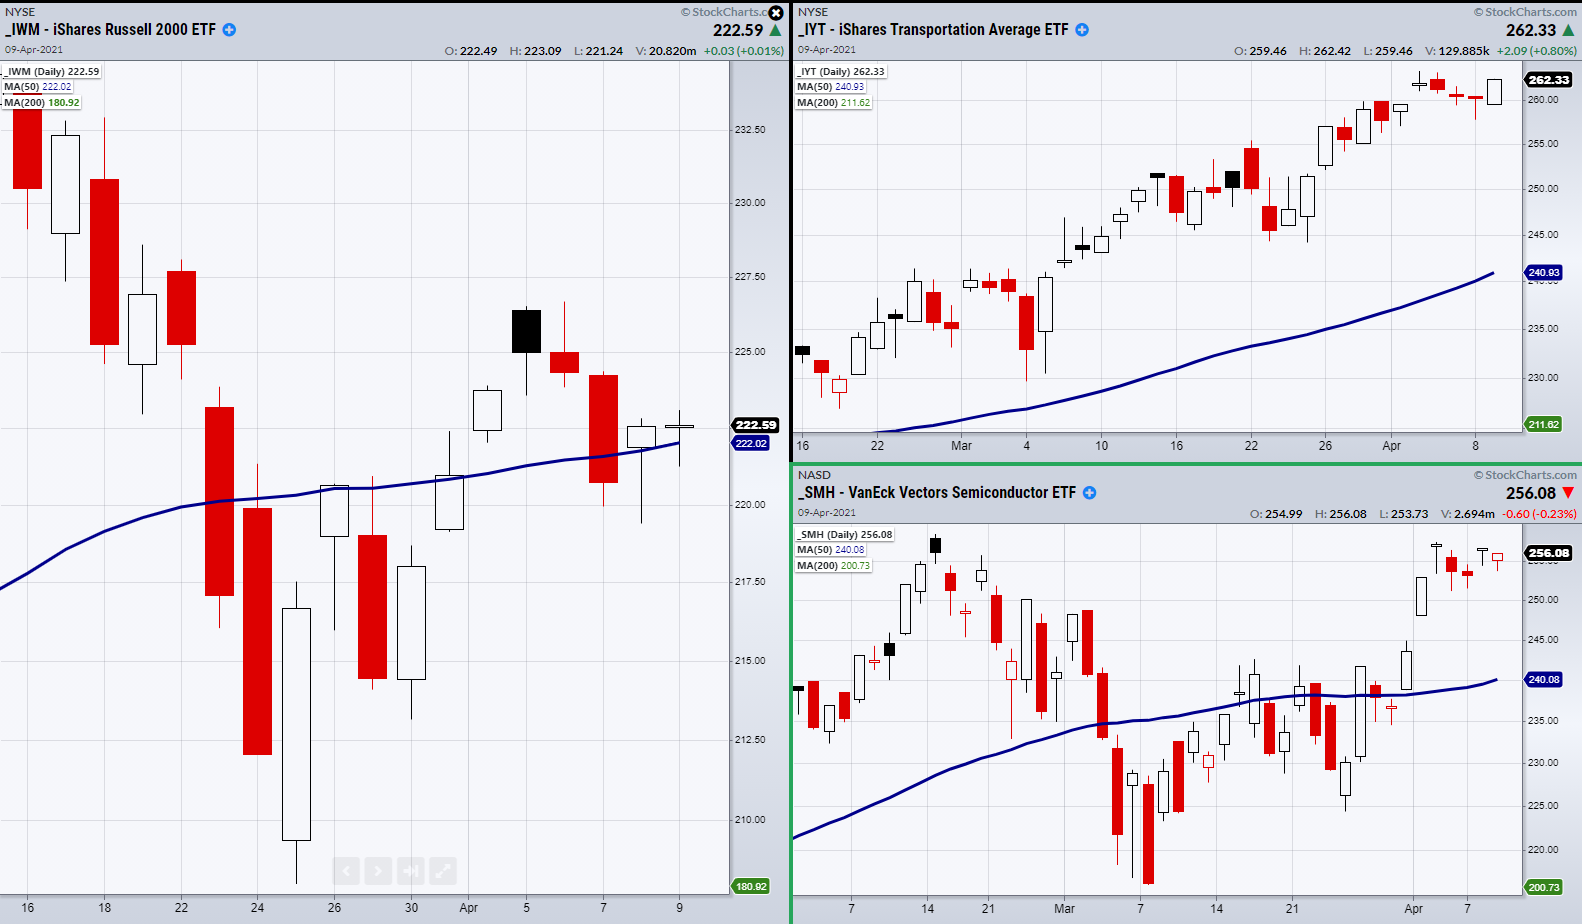
Last week’s focus was the Russell 2000 ETF (NYSE:IWM), Transportation Average ETF (NYSE:IYT), and VanEck Vectors Semiconductor ETF (NYSE:SMH).

1. IWM
IWM has shown us general market direction and sentiment as it contains 2000 small cap U.S. companies.
2. IYT
IYT is the backbone or demand side of the economy as the U.S. opens with the increasing vaccine deployment.
3. SMH
SMH has been involved in this year’s tech boom, but also in one of this year’s biggest supply chain disruptions.
For a plethora of reasons, from car manufacturing to increasing computer needs from the work at home environment to crypto mining, the tech space has been hard pressed for computer chips to meet demands of large and growing tech companies.
In Focus
From a technical standpoint IWM continues to flirt with its 50-day moving average at $222.02.
Last week, IYT started to drift lower, making it look worrisome when paired with IWM which fluctuated between breaking its major moving average and holding its current price level.
On top of that, SMH has been struggling to break through highs at 258.59.
With that said, rising worries of inflation linger in the background of many investors’ minds.
Therefore, we have been watching the Invesco DB US Dollar Index Bullish Fund (NYSE:UUP) along with precious metal and food commodities, like Invesco Agricultural Fund ETF (NYSE:DBA) and gold (NYSE:GLD).
If the dollar were to begin struggling and break the support of the 50-DMA, this could cause fear as a weakening dollar buys less goods, thus increasing import prices which can lead to inflation.
DBA and GLD can also display signs of inflation as investors flock to their safety as prices increase.
As for Monday’s game plan, we can watch for our 2 key ETFs and Index to hold, break, or clear their current price levels.
From a bullish standpoint, this means watching IWM to hold over its 50-DMA and for IYT and SMH to head back up to recent highs.
Here are must-watch videos.
ETF Summary
- S&P 500 (SPY) At all-time highs.
- Russell 2000 (IWM) Watch to hold over the 50-DMA at 222.02.
- Dow (DIA) 332.86 support.
- NASDAQ (QQQ) 338.19 high to clear. Support 321.40.
- KRE (Regional Banks) Support 64.77 the 50-DMA
- SMH (Semiconductors) 258.59 resistance.
- IYT (Transportation) 263.33 high to clear.
- IBB (Biotechnology) 145.50 support.
- XRT (Retail) Needs to clear 93 then 96.27.
- Volatility Index (VXX) Needs to find support.
- Junk Bonds (JNK) Support 108.58.
- LQD (iShares iBoxx $ Investment Grade Corp Bond ETF) 131.71 next resistance area the 50-DMA.
- IYR (Real Estate) 93.33 the 10-DMA
- XLU (Utilities) 64.19 support.
- GLD (Gold Trust) 164.14 gap needs to fill.
- SLV (Silver) 23.09 Support the 200-DMA.
- VBK (Small Cap Growth ETF) 282.27 resistance area.
- UGA (US Gas Fund) 30.91 support area. 32.66 resistance.
- TLT (iShares 20+ Year Treasuries) 134.97 support. 138.66 resistance.
- USD (Dollar) 92.34 the 200-DMA.
- MJ (Alternative Harvest ETF) 21.55 support. More sideways price action.
- WEAT (Teucrium Wheat Fund) Watching for second close over 50-DMA.
