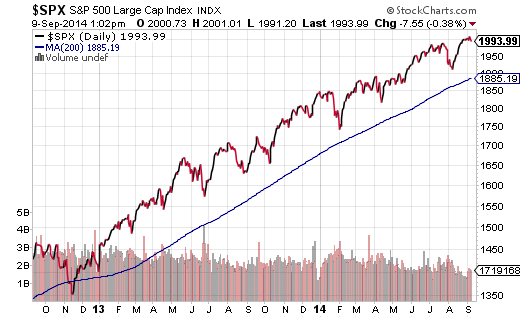
What is the longest period of time that the S&P 500 has traded without a 10% correction? According to Bespoke Investment Group, the record is a blissful 1,127-day run from July 1984 to August 1987. The current rally? 1,069 days. The waters are so calm, in fact, that only 13.3% of respondents to the most recent Investors Intelligence Sentiment Survey described themselves as “bearish.” The contrarian indicator at 13.3% represents the lowest level of bearishness since February 1987.
Should we connect the dots between Black Monday’s carnage (10/19/1987) and present-day stock market dynamics? That exercise should be left for gloom-n-doomers. You may even want to read commentary by David Tice of the Prudent Bear Fund (BEARX) or watch video involving Marc Faber.
On the other hand, Mark Twain had the right idea when he said, “History never repeats itself, but it often rhymes.” For instance, when adviser bearishness registered dramatic lows in the past, stocks have had a tendency to pull back significantly. Similarly, price corrections of 10% or more tend to take place every 12-18 months; today’s run-up is closing in on a 27-year old record for the longest period without corrective activity. Additionally, the S&P 500 has already broken a record with respect to the number of sessions that the benchmark has traded above its 200-day moving average.
In technical analysis, one presumes that price movement over time matters. And historically speaking, benchmarks like the S&P 500 pull back to their mean (i.e., 200-day moving average) more frequently than once in two calendar years; an index will even spend a number of months below a key average.
The idea that history rhymes is built into the fabric of fundamental stock analysis as well. Right now, trailing (12 months) and cyclically adjusted (10 years) price-to-earnings (P/E), price-to-book (P/B), price-to-cash flow and price-to-dividend all forewarn extreme overvaluation for U.S. equities. Even Warren Buffett’s favorite measure for addressing value in stock assets – total market cap to GDP – resides at 125 percent. That is roughly 15% higher than the overvalued conditions that existed in 2007. The only time that total market cap to GDP was more worrisome in history? At the start of 2000.
Again, I will let others discuss the “inevitable crash” or “imminent collapse.” I find it more practical to address the ways in which one might prepare for a near-term correction of 10.0%-19.9%.
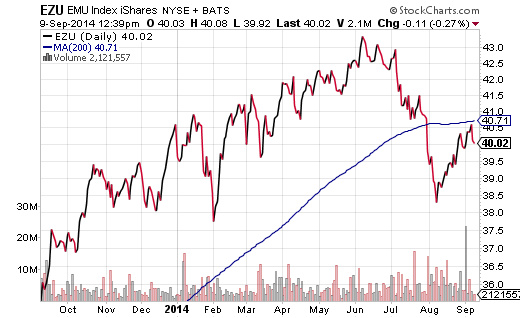
First, reduce exposure to ETF assets that have “rolled over.” These assets include ETFs with strong ties to the depreciating euro-dollar as well as the recently troubled British pound. You do not have to sell every share of funds like Vanguard Europe (ARCA:VGK) or iShares MSCI European Monetary Union EMU (NYSE:EZU) or iShares MSCI United Kingdom (ARCA:EWU). By the same token, lightening up on highly correlated assets to the S&P 500 that have already dropped below respective long-term moving averages should be beneficial in a corrective phase.
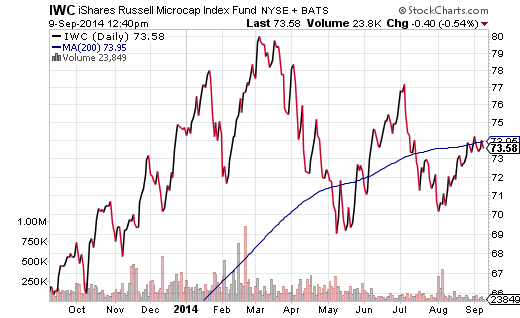
Second, understand that the debate on whether the U.S. economy is actually improving or stagnating is less critical than the market’s reaction to various data points. And what we have seen throughout 2014 is relative underperformance by small-cap and micro-cap stocks. Lighten your exposure to small cap proxies like iShares Russell 2000 (ARCA:IWM); the reality that IWM is hitting lower highs is disconcerting to chart watchers. Even more disconcerting has been the abysmal performance of the smallest public company shares in iShares MicroCap (NYSE:IWC). This exchange-traded tracker has been logging lower high since March, has already declined 10% from March highs and currently trades below its 200-day. (Note: Market reactions to the Federal Reserve’s report on small business ownership probably does not help either, as the percentage of American families that own a small business is at the lowest level ever recorded.)
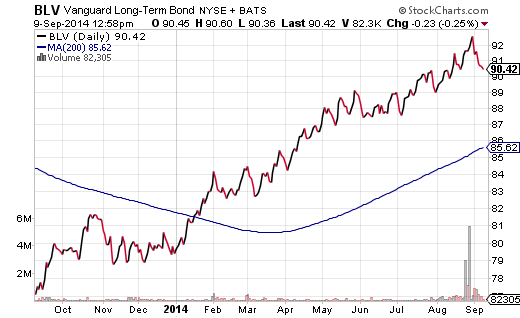
Third, use some of the cash that you have raised to increase your exposure to safer-haven assets. I recommend employing assets that might be trending higher already and that provide historical cover in stock market pullbacks. While the Japanese yen, the Swiss franc and Gold have safer-haven properties, the strength of the US Dollar has wreaked havoc on them lately. Longer-term U.S. Treasuries and longer-term investment grade U.S. bonds have been winners during the stock rally. It follows that they possess capital appreciation potential in the present as well as traditional safer haven appeal going forward. Vanguard Long-Term Bond (ARCA:BLV) and Vanguard Extended Duration (NYSE:EDV) should serve you well in a “stock shock.”


