Last Wednesday, Mish went live on Fox Business “Making Money with Charles Payne” and gave out a very bold pick. Or, at least bold in the eyes of the general populous as most of the media’s coverage has focused on big tech and the Crypto space.

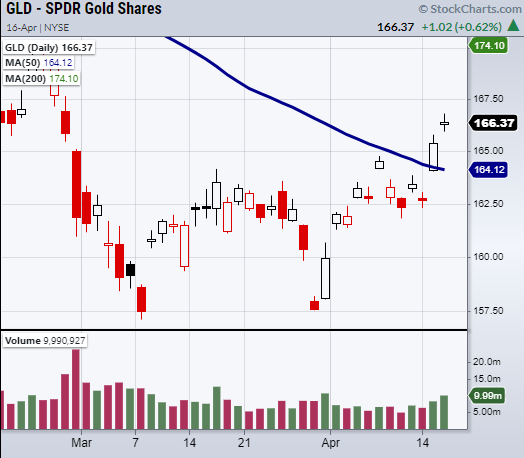
Having said that, on Thursday, gold gapped up and finished the week with a second close above its 50-Day moving average at $164.12.
So, why did we pick gold before its big move up when most of the media’s sentiment was lackluster? Here are three main reasons.
1. Rising interest rates
Governments and central banks around the world have borrowed huge amounts of money to revive the economy. Without any clear plan to dig the U.S. out of debt, there is rising worry that the US dollar could be under enormous pressure. This in turn would boost gold as its limited supply in the face of inflation can be very appealing.
2. A hedge against the fear of the unknown
Currently, there is rising tension in the middle east between Iran and Israel. If the situation were to escalate, it is unclear how the current administration would react. This is a big unknown for investors who can use gold as a safety play/hedge while they wait for more clarity.
3. Technical analysis
By taking look at the daily chart above, you can see a formation of a double bottom pattern created from 3/8 and 3/30. Each bottom was followed by a large move higher, either by a gap or a large candle range.
Furthermore, the increased volume on 3/30 showed that a large number of buyers came in to support the move back up. For these reasons, we should keep a watch on gold to continue upwards. However, if gold were to turn around and head lower, the main support would be from the double bottom price level at $157.
Ideally, it should hold over the 50-DMA area at $164.12.
ETF Summary
- S&P 500 SPY) Support 410.82 the 10-DMA.
- Russell 2000 (IWM) 219.39 support. Resistance 226.69.
- Dow (DIA) 337.11 support the 10-DMA.
- NASDAQ (QQQ) 338.19 needs to hold as new support.
- KRE (Regional Banks) Support 65.91 the 50-DMA. Resistance 68.35.
- SMH (Semiconductors) Resistance 258.59.
- IYT (Transportation) Holding near highs. 257.73 support.
- IBB (Biotechnology) 145.87 support. Resistance 156.29.
- XRT (Retail) Needs to clear 93 then 96.27. 10-DMA support area 91.64.
- Volatility Index (VXX) Needs to find consolidation or support area.
- Junk Bonds (JNK) 108.61 support. 109.65 next resistance.
- XLU (Utilities) 67.93 resistance.
- SLV (Silver) Failed to clear the 50-DMA at 24.19.
- VBK (Small Cap Growth ETF) New support the 50-DMA at 282.53.
- UGA (US Gas Fund) 32.66 now support.
- TLT (iShares 20+ Year Treasuries) 140.13 the 50-DMA.
- USD (Dollar) 91.59 pivotal area.
- MJ (Alternative Harvest ETF) 20.78 needs to hold. Resistance 21.55.
- WEAT (Teucrium Wheat Fund) Needs to hold over 6.30.
