Whenever I am asked about which ETFs have the most exposure to a specific stock, I turn to my friends at ETFDB.com. Their free stock exposure tool is an excellent way to quickly assess the weight of any given company within the ETF universe.
In the case of a ubiquitous stock like Apple Inc (NASDAQ:AAPL), which is the largest publicly traded company in the U.S., the list of funds is lengthy. Technology sector ETFs are a given. However, there are also a surprising number of dividend indexes, diversified large-cap themes, and other factor-based options to consider.
I have written extensively about how the composition and position sizing of the underlying holdings in an ETF is paramount to how it will perform. With that in mind, let’s look at the top three funds with the highest exposure to AAPL.
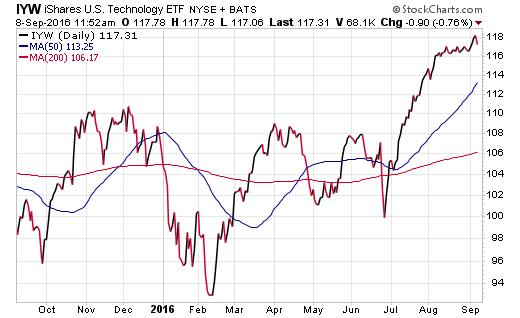
If you are a true fanatic, the number one ETF on the list is the iShares U.S. Technology ETF (NYSE:IYW). This fund currently has 15.59% of its portfolio dedicated to Apple stock as the largest holding.
IYW also tracks 138 other U.S.-based tech companies that span virtually all market cap sizes. This includes well-known names such as Microsoft Corp (NASDAQ:MSFT) and Facebook Inc (NASDAQ:FB).

Despite the diversified number of holdings, IYW is going to be primarily driven by the performance of its top 10 constituents. Nevertheless, it’s more diversified than owning an individual stock and can potentially spread your risk over multiple areas of the technology sector. It is also worth noting that this ETF comes with a relatively high expense ratio of 0.44% for a passively managed sector fund.
The Technology Select Sector SPDR (NYSE:XLK) is probably more well-known by ETF enthusiasts. This technology benchmark is the next highest ranked option for Apple exposure with 13.05% of its portfolio dedicated to the company. XLK contains 75 large-cap technology companies from within the S&P 500 Index and has $13.3 billion in assets under management.
This fund is likely going to be a more liquid and heavily traveled alternative than IYW because of its tenure. XLK debuted in 1998 as one of the first sector-focused ETFs and charges a relatively low expense ratio of 0.14%.
Lastly, the Vanguard Information Technology ETF (NYSE:VGT) an option for low-cost index investors. VGT has 12.60% of its portfolio exposed to AAPL stock. It also encompasses 380 other stocks in the technology sector and charges an expense ratio of just 0.10%.
Similar to its peers, the majority of the VGT portfolio is driven by its top components despite its highly diversified nature.
The Bottom Line
It’s not often that an individual stock takes such a prominent role in a single sector of the economy. The size advantage of Apple, combined with its global brand appeal and healthy financial characteristics, make this company a unique outlier. The aforementioned ETFs allow you to have a significant stake in the performance of Apple without the typical business risk that accompanies direct share ownership.
Disclosure: FMD Capital Management, its executives, and/or its clients June hold positions in the ETFs, mutual funds or any investment asset mentioned in this article. The commentary does not constitute individualized investment advice. The opinions offered herein are not personalized recommendations to buy, sell or hold securities.
