For several years now, I have expressed concern about the accumulation of debt by governments, corporations and households. Some folks seem to recognize that – across the board – total debt levels are on an unsustainable path. Others have argued that the only thing of importance is the ability to service existing obligations, and that each group is quite capable of paying back the interest on their loans.
Unfortunately, the naysayers' argument ignores several unpleasant realities. First, borrowers at all levels – family, company, government – continue to increase their total debt as well as increase their interest expense. Borrowing costs would have to drop further to maintain a favorable picture for debt servicing. Secondly, it is unlikely that borrowers at all levels will have permanent access to lower and lower rates. “Subprime” was not merely a 2008 struggle, nor was the euro-zone sovereign debt crisis isolated to 2011. Both the domestic credit catastrophe as well as the European version involved an inability to pay when bond prices fell as corresponding yields climbed.
Not surprisingly, corporations will be heavily pressured in 2016. Many will see more and more of their cash flow being diverted to the repayment of obligations. Some will fend off default concerns, while others will succumb.
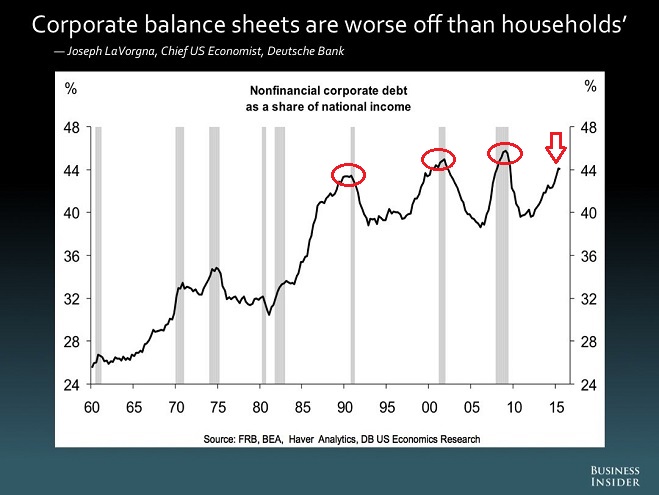
Back in mid-October, Bloomberg presented an article on corporate America's epic debt binge. The author chronicled the alarming deterioration of American balance sheets, from total debt excesses resulting in the highest interest expense ever to the lowest capacity to service obligations (i.e., a.k.a. interest coverage) since 2009. More recently, Deutsche Bank's (NYSE:DB) Chief U.S. Economist described corporate balance sheets as being worse off than household balance sheets. Corporate debt as a percentage of national income has been pushing levels that remind us of the past three recessions.
If companies have been borrowing like intoxicated Air Force pilots, did those companies at least spend the money in beneficial ways? That depends. Most executives chose to borrow dollars to acquire stock shares of their own corporations – an activity that reduces total shares in existence while simultaneously making those shares more scarce for would-be investors. Stock buybacks also improve investor perceptions of profitability since earnings are measured against an ever-decreasing number of stock shares; that is, “goosing” earnings per share (EPS) is a popular sport for executives who have been tethered to near-term results.
However, spending borrowed dollars on physical assets (e.g., property, industrial buildings or equipment) as well as new projects is often beneficial to the long-term well-being of a corporation. Not doing so when the funds are available becomes even more problematic when there are less dollars to spend in a decelerating economy.
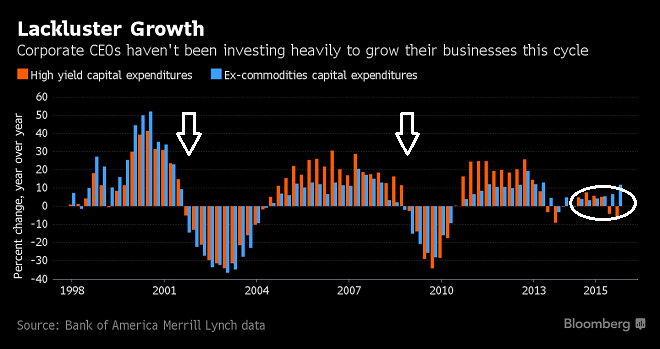
Consider the above-mentioned capital expenditures, or “CapEx,” in previous business cycles. In the 1992-2000 expansion and the 2003-2007 expansion, executives spent handsomely on property and projects; companies reduced capital expenditures dramatically when the dollars got tight in the 2001 contraction as well as the Great Recession (2008-2009).
Now shift your attention to the last few years from early 2014 to early 2016. Relative to prior economic recoveries, CapEx has been negligible. The implication? Companies that invest for the future have greater confidence in their business models, more so than those that primarily aim to beat quarterly expectations through financial slight of hand. Yet companies have not really been investing for the future in a meaningful way.
Ironically, accounting gamesmanship notwithstanding, earnings-per share at S&P 500 corporations has been waning since September of 2014. Sales have been falling for just as long.
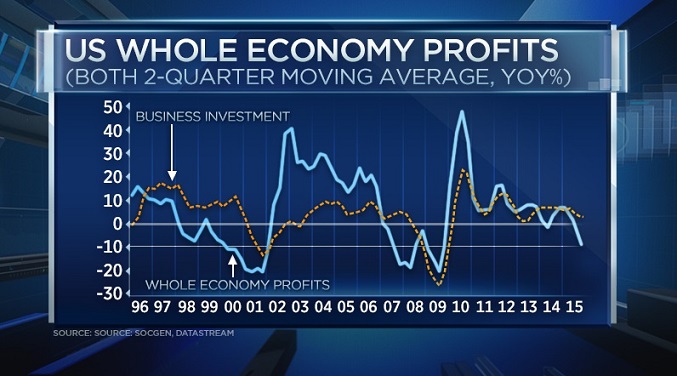
This brings me to a third chart. The Bureau of Economic Analysis (B.E.A) has a preferred measure of profitability known as “whole economy profits.” In brief, it assesses profits that are derived from current production by removing inventory issues. Purportedly, this provides a strong indication of vulnerability to shocks as well as outright economic contraction.
The last two times that the six-month moving average (two quarters) for whole economy profits dipped below 10%, the U.S. economy fell into recession. Moreover, the last two times this occurred – in the beginning of 2000 and mid-way through 2007 – severe stock bear markets followed.
Let’s Review: Interest expense, interest coverage and total debt levels are all on the rise. That may make it more difficult to expand operations for the longer-term future via capital expenditures. Lower CapEx may even imply that non-GAAP profits, GAAP profits and whole economy profits will continue to struggle, leaving less cash flow for additional buybacks or business investment. Moreover, when you place these trends in the context of far-reaching slowdowns around the globe, one may find little longer-term investment reward for piling into the S&P 500 SPDR Trust (NYSE:SPY) at a trailing 12-month GAAP P/E of 23.5.


