My personal advise (for what it’s worth) in 2016 is to have an open mind on the markets.
You should absolutely have an opinion, but do not fall in love with a position or directional bias, and be prepared to act in the name of capital preservation.
Increase your education around less familiar asset classes and look at international markets to increase opportunity. The ability to trade international shares has never been easier, with traders able to hedge currency exposure more cheaply and effectively. If you don’t understand how to short markets and profit from a move lower in price, then learn do so as I feel there are going to be more opportunities on the short side than we’ve seen for many years.
I am confident 2016 will hold some amazing opportunities to generate capital. But for those looking to survive and thrive in the markets, there will be times that capital preservation will be key and how one adapts to changes in implied volatility will be the difference.
It is widely expected that 2016 will be a year that politics and international relations will trump economics. Understanding trend, momentum, price action and technical analysis will be key, as it’s hard enough for traders to interpret economics and how that impacts assets, let along be a political analyst. Take today’s 2.7% initial pop in front month Brent oil on the back of the strained relations between the Saudis, Iran and the West. The market was clearly voting that geo-politics could see a supply-side impact, however as the day has gone on, sellers have acted on the idea we could also actually see an increased beggar-thy-neighbour stance and OPEC nations extracting more market share. Oil should be sold on rallies and the $57 year-end consensus for WTI is likely to be lowered.
Once again, the consensus trade for 2016 is to be long the USD, with consensus estimates calling for EUR/USD to trade to $1.05 in Q4, USD/JPY ¥125 and AUD/USD $0.6900. Fundamentally, there are still many attractions in being long USDs, specifically if we see December wages growing 2.8% (annualised), which is what is expected as part of this week’s US payrolls report. This would be the fastest pace of wage appreciation since June 2009 and would almost certainly see the probability of a hike in March/April period increase from the current 50% priced in.
Staying in the FX space, CNY (Chinese yuan) remains the must-watch currency this year, as the implications of a longer-term deprecation holds big ramification for global trade volumes. Today’s 96 pip weaker CNY ‘fixing’ from the People’s Bank of China (PBoC) seems to have caused good selling in China’s export competitors with KRW (Korean won) and AUD under strong pressure today. Currency wars seem to have settled down somewhat in 2H 2015, but will China change this dynamic?
AUD/JPY has been heavily sold today with a poor Caixin China PMI (48.2 vs 48.9 expected) hurting risk sentiment. The technicals on AUD/JPY are looking quite poor here and I certainly favour further downside in this pair in the short-term. Risk in general seems to have come off today with the Shenzhen Composite down 5% on what are strong volumes for this time of year. S&P futures are 0.8% lower from the opening tick and our European equity calls are looking weak.
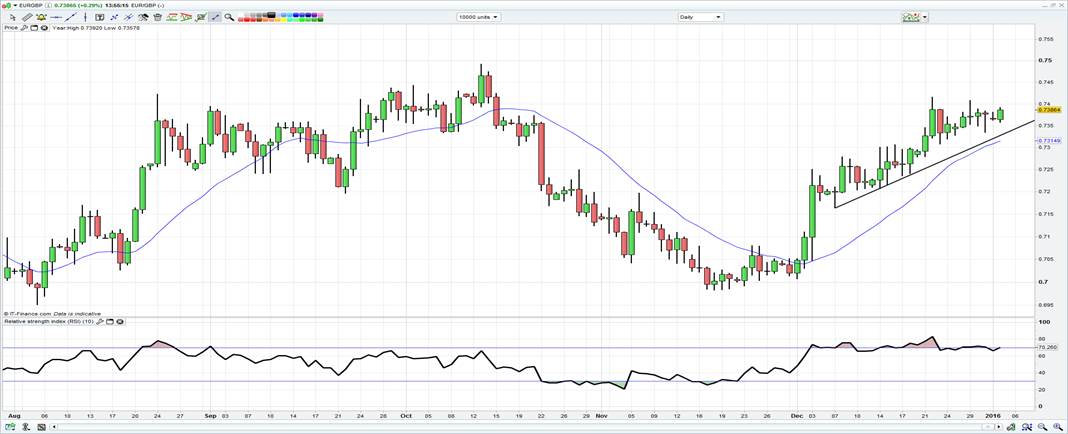
Back on the politics theme, GBP is worth watching this year. Shorter-term, there is some focus on the fact that EUR/GBP has rallied for six weeks in a row. We can’t rule out a seventh consecutive week, but this run has only occurred twice in the history of the EUR (hat tip to Predictive Markets), so this could be a historic moves. I am actually inclined to short EUR/GBP (spot currently GBP0.7372) on this ground, but the trend higher is just too positive for me at this stage.

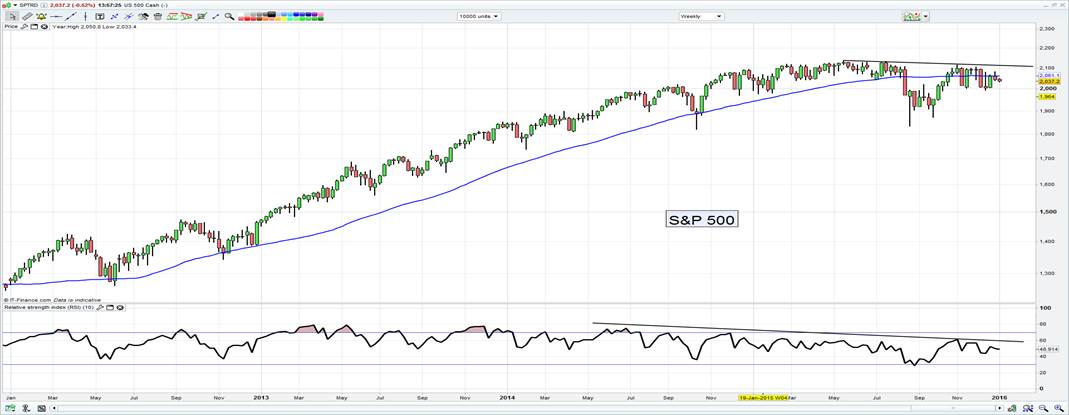
US equities are expected to end the year at 2207, generating an 8% return (ex-dividends). It does feel as though there is an air of pessimism that we haven’t felt in prior years and the big question here remains ‘will the high growth, momentum names’ such as Amazon (O:AMZN), Netflix (O:NFLX), Facebook (O:FB) and Google (O:GOOGL) continue working? Will energy do better in 2016? While breadth may be poor, the longer-term chart of the S&P 500 is quite neutral and hardly thematic of aggressive short positions and the 50-week moving average is headed perfectly sideways. I am certainly feeling that if the bulls see a move into 2200 this year, they would be very content and it promises to be another slog for money managers who have to benchmark.

There is no consensus estimate I can see for the Australian equity market. Despite a lowly 210 basis point drop in 2015, it masks increased volatility, with the index trading in a 1087 point range in 2015. This is the biggest annual range since 2011 and shows the journey from A to B has been a fascinating one. We do enter 2016 with the broader index trading on 16.1 times forward earnings (an 11% premium to the seven-year average), and as such, value is harder to find. We also have the headwind of the financial sector having a near 50% weight on broader market (the next biggest weighting is the materials sector with a 12% weighting), so this needs to be taken into account when trading the market. Trading the ASX 200 is effectively trading the financial sector.
