10 Exchange Traded Funds That Matter Now (And Where They Might Go Next)

Published 12/10/2020, 01:00 AM
Updated 07/09/2023, 06:31 AM
NDX
-
XAU/USD
-
EEM
-
QQQ
-
GC
-
GLD
-
DBC
-
IXIC
-
KBE
-
XLE
-
XLF
-
GDX
-
SMH
-
ITB
-

When things get quiet—and they have become SO quiet lately, as if people have decided just to call the entire year a “wrap” at this point—I like to trot out the ETFs and speak in general terms about what I’m seeing. So that’s what we’ll do this with post.

Below are ten exchange traded funds, with some commentary in the caption of each. As usual, click on any chart for a much larger version.
DBC Chart

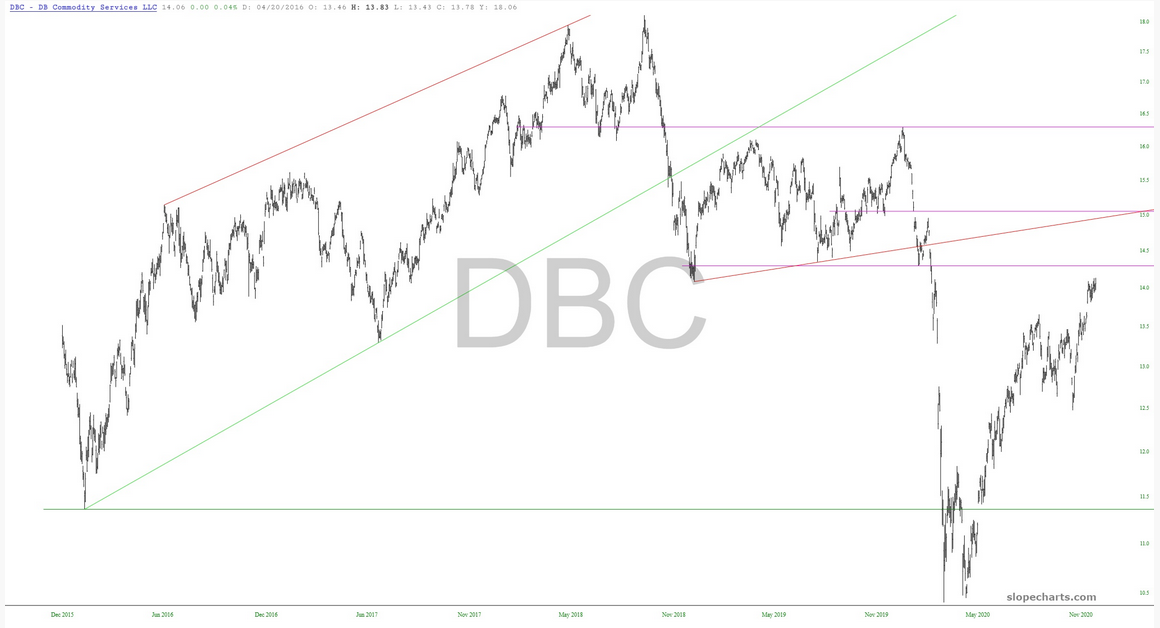
1. Invesco DB Commodity Index Tracking Fund (NYSE:DBC): Commodities continue to hover in their “stalled” position. I think it’s going to just hover below that horizontal until it finally succumbs to economic gravity.
EEM Chart

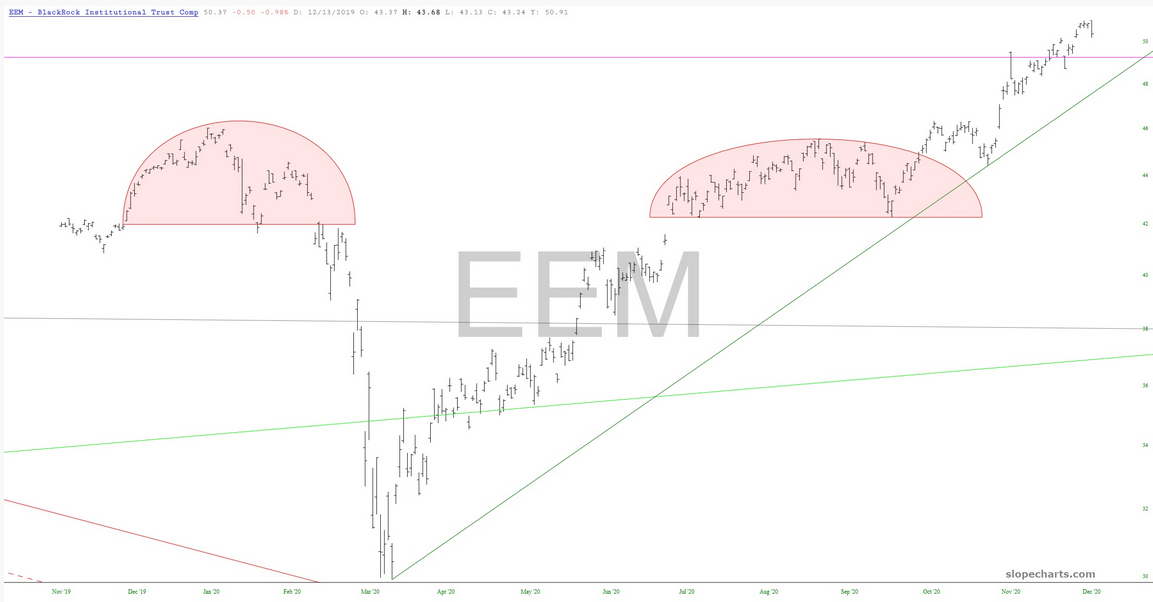
2. iShares MSCI Emerging Markets ETF (NYSE:EEM): This had been (past tense!) a beautiful pair of rounded tops, but it broke free and has now lurched to lifetime highs.
GDX Chart

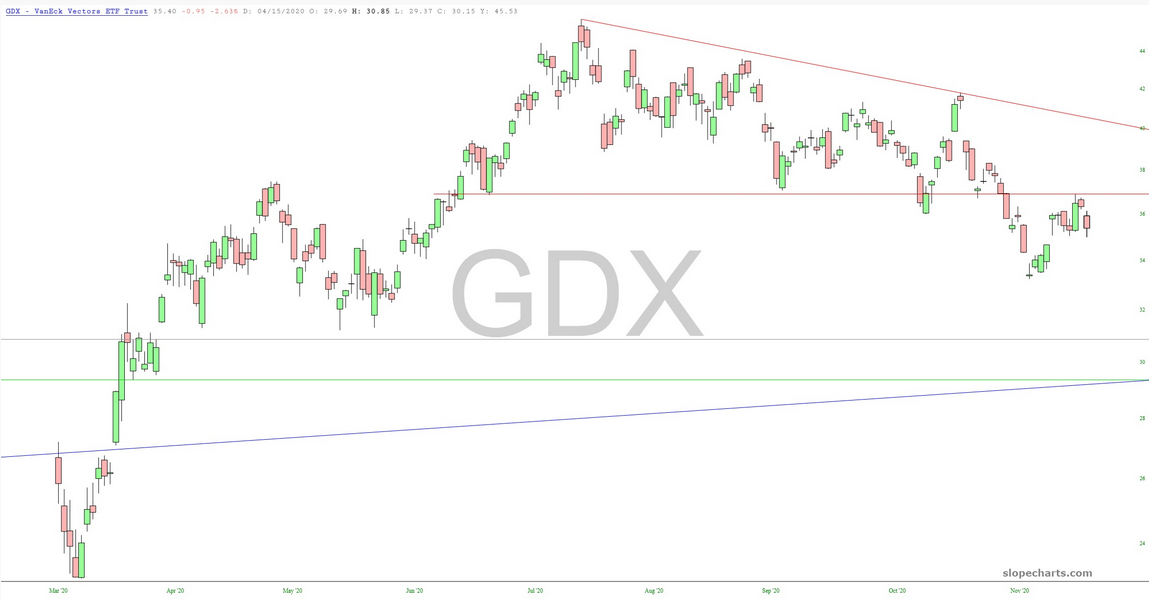
3. VanEck Vectors Gold Miners ETF (NYSE:GDX): I was really pleased with how this went. I’ve been waiting for precious metals, and miners, to turn lower, and perhaps we got a start on this yesterday.
GLD Chart

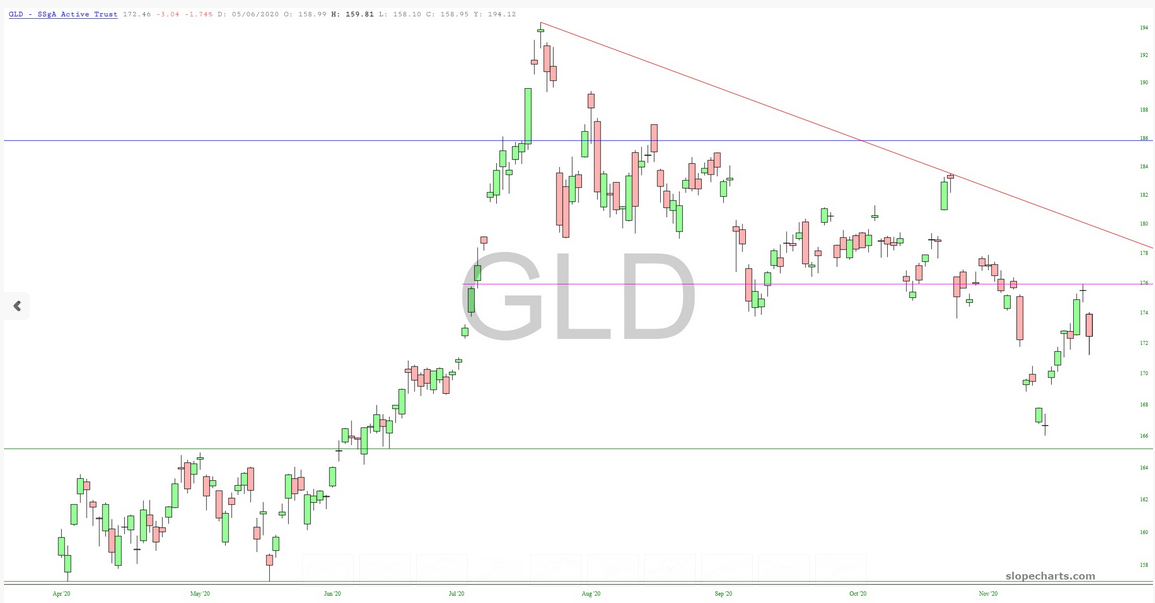
4. SPDR® Gold Shares (NYSE:GLD): The same can be said, of course, for gold, which has a nice clean pattern above it.
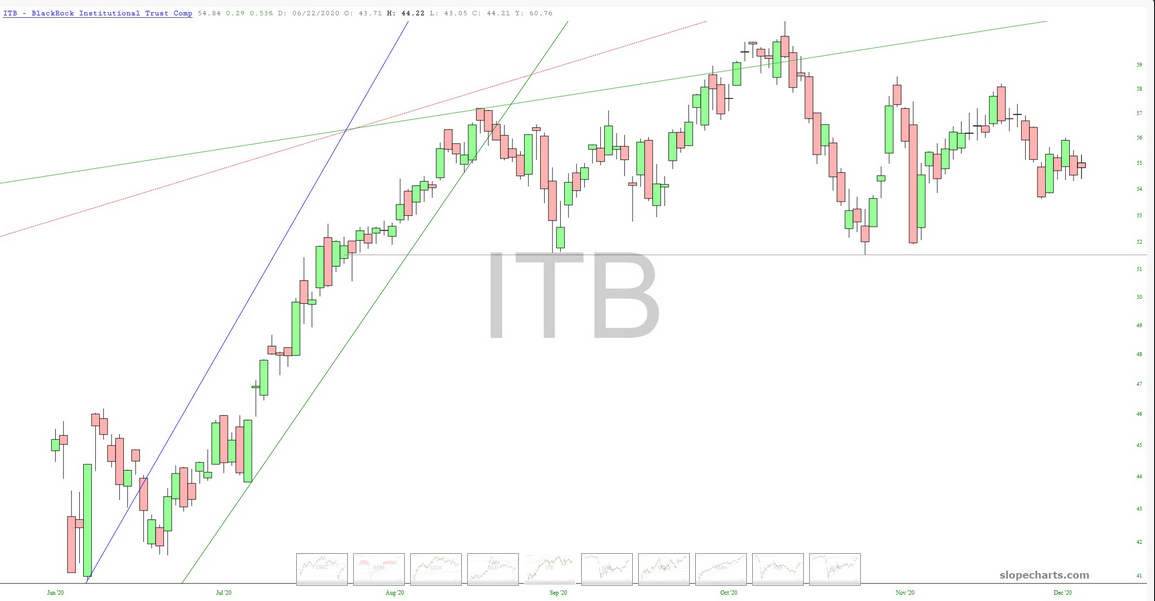
ITB Chart

5. iShares U.S. Home Construction ETF (NYSE:ITB): Homebuilders ever-so-slowly continue to carve out what, in the end, could be a very good top
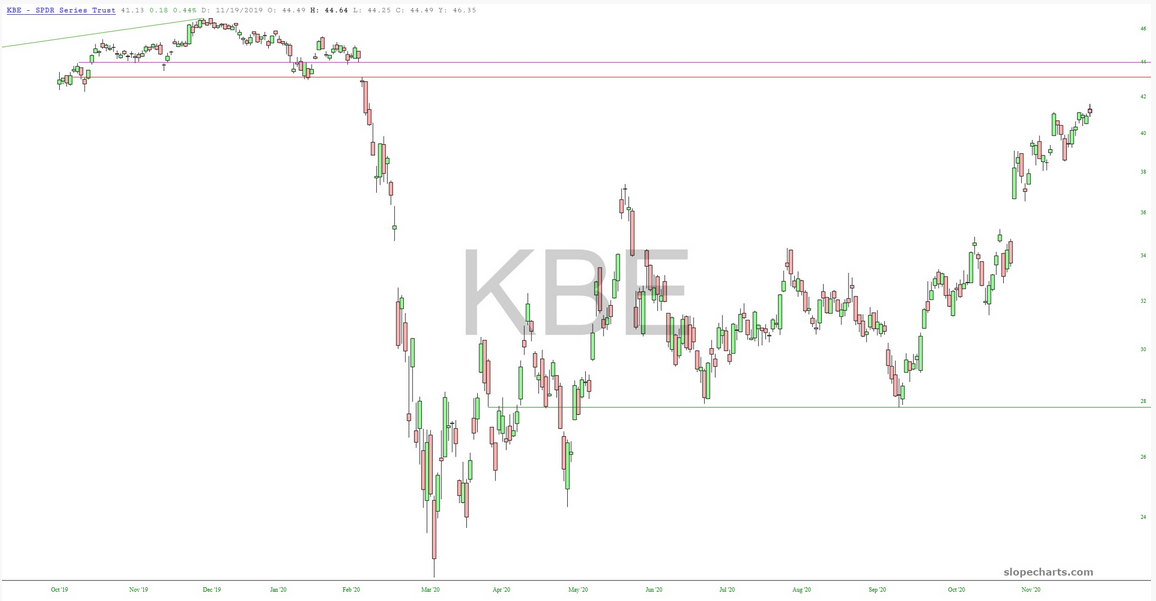
KBE Chart

6. SPDR® S&P Bank ETF (NYSE:KBE): Banks got some strength yesterday. There are some formidable horizontals above, most particularly the higher one, which is anchored to a price gap.
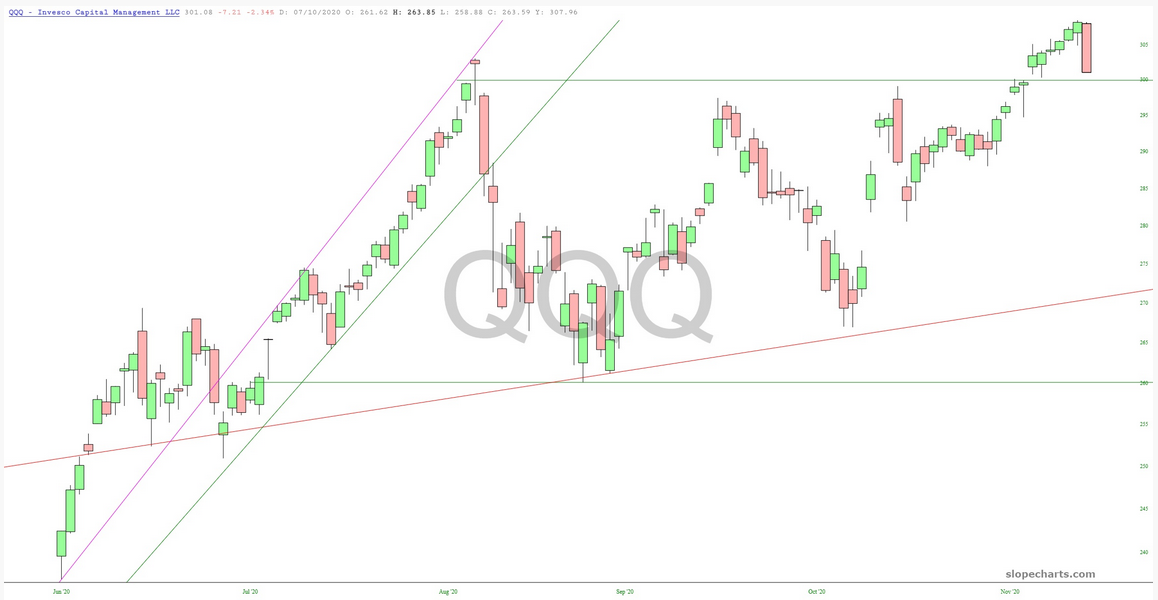
QQQ Chart

7. Invesco QQQ Trust (NASDAQ:QQQ): The NASDAQ 100 gave up about 7 days’ worth of gains in a single session. We are very near an important support level.
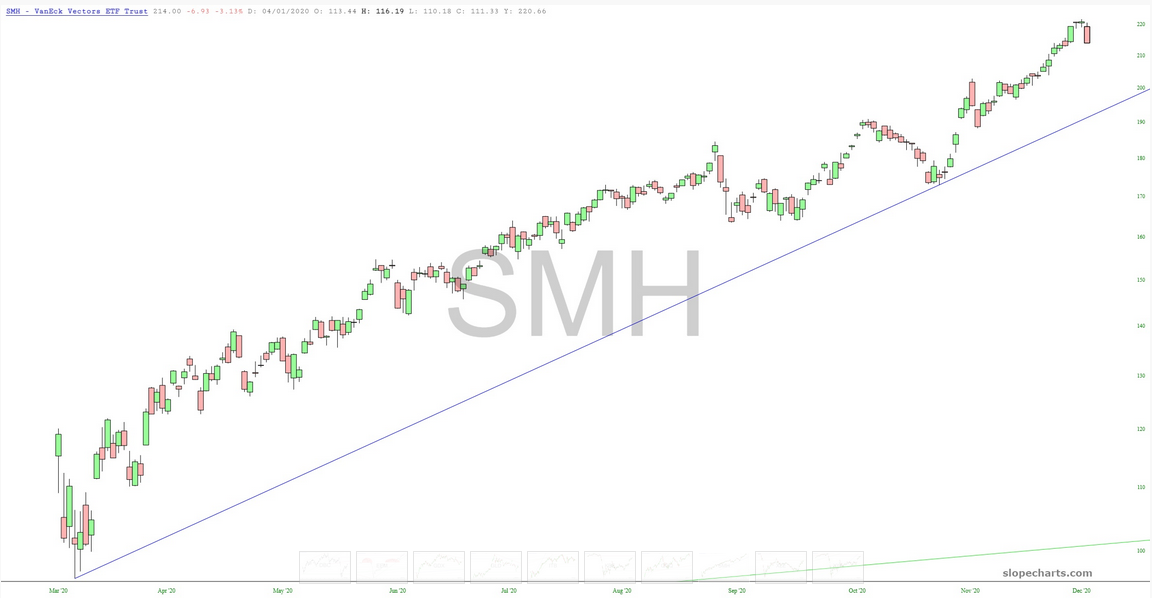
SMH Chart

8. VanEck Vectors Semiconductor ETF (NYSE:SMH): A bulwark of the NASDAQ’s strength is semiconductors. This sector slipped, although it is nowhere near breaking its long-term uptrend.
XLE Chart

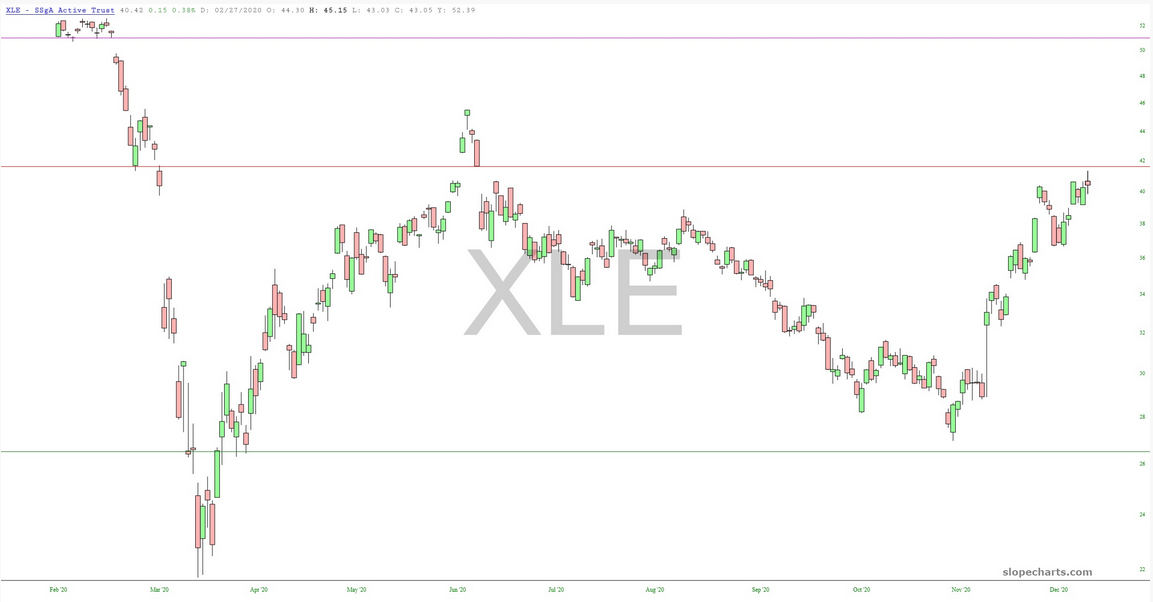
9. Energy Select Sector SPDR® Fund (NYSE:XLE): Energy is very close to its own price gap, so this could be a low-risk, high-reward zone for shorting.
XLF Chart

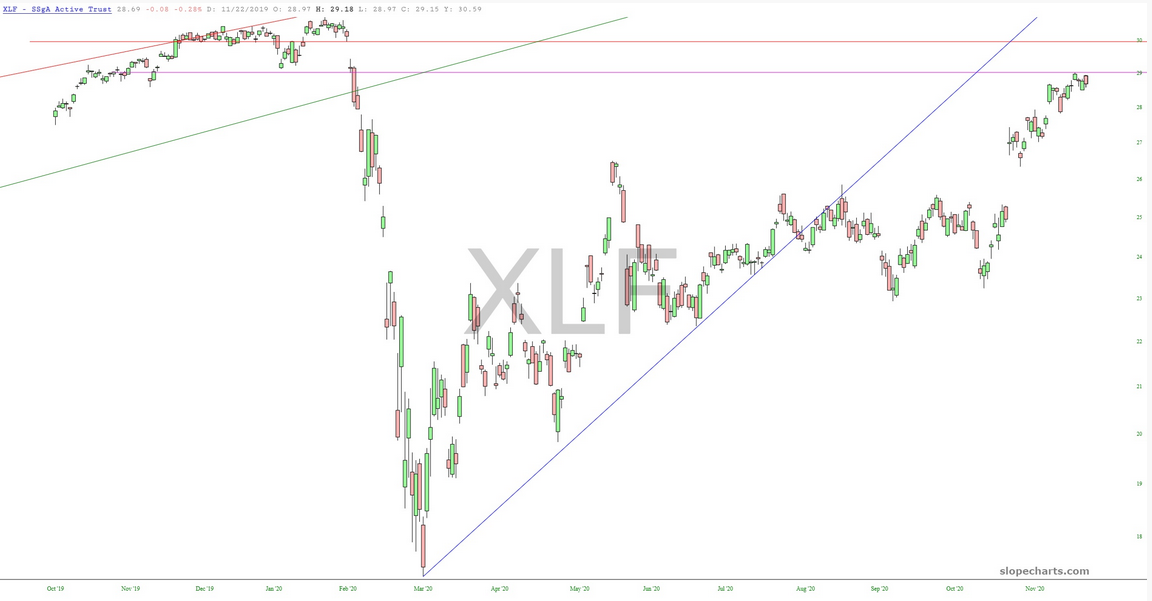
10. Financial Select Sector SPDR® Fund (NYSE:XLF): Finally, the financials fund has the same characteristics of KBE, shown earlier.

Latest comments

Loading next article…
Risk Disclosure: Trading in financial instruments and/or cryptocurrencies involves high risks including the risk of losing some, or all, of your investment amount, and may not be suitable for all investors. Prices of cryptocurrencies are extremely volatile and may be affected by external factors such as financial, regulatory or political events. Trading on margin increases the financial risks.
Before deciding to trade in financial instrument or cryptocurrencies you should be fully informed of the risks and costs associated with trading the financial markets, carefully consider your investment objectives, level of experience, and risk appetite, and seek professional advice where needed.
Fusion Media would like to remind you that the data contained in this website is not necessarily real-time nor accurate. The data and prices on the website are not necessarily provided by any market or exchange, but may be provided by market makers, and so prices may not be accurate and may differ from the actual price at any given market, meaning prices are indicative and not appropriate for trading purposes. Fusion Media and any provider of the data contained in this website will not accept liability for any loss or damage as a result of your trading, or your reliance on the information contained within this website.
It is prohibited to use, store, reproduce, display, modify, transmit or distribute the data contained in this website without the explicit prior written permission of Fusion Media and/or the data provider. All intellectual property rights are reserved by the providers and/or the exchange providing the data contained in this website.
Fusion Media may be compensated by the advertisers that appear on the website, based on your interaction with the advertisements or advertisers.
© 2007-2025 - Fusion Media Limited. All Rights Reserved.