This post was written exclusively for Investing.com
The equity markets continue to be in a state of flux as they attempt to climb from their Feb. 28 lows, with massive price swings daily. However, there continue to be signs of improvement that are slowly taking shape. To find one of those signs, one must swing over to the opposite side of the world and turn to the South Korean stock market, away from the volatility of the U.S. equity market.
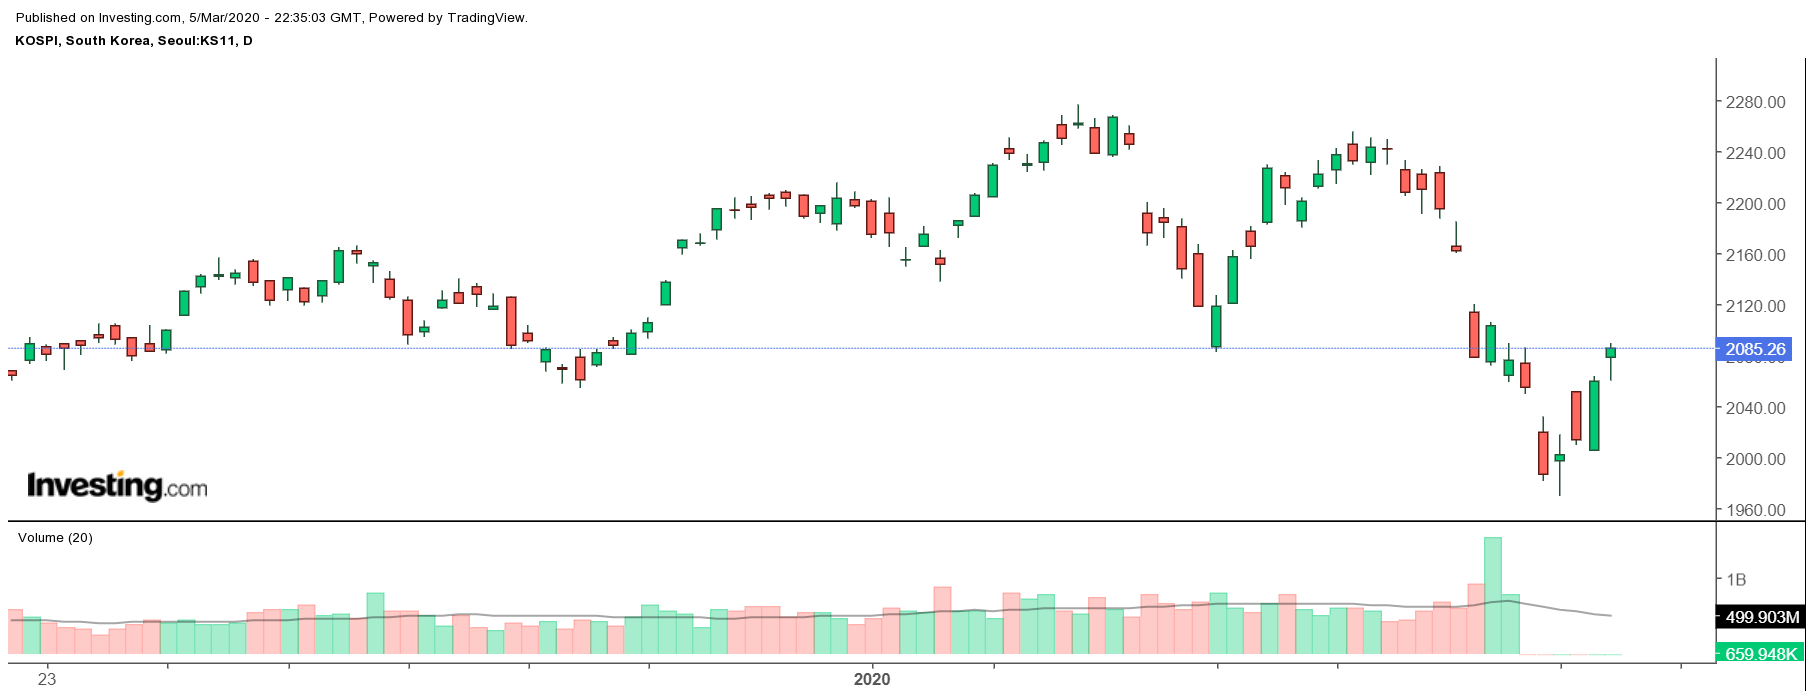
South Korea has been one of the hardest-hit countries by the coronavirus, and yet the KOSPI has been showing improving trends, that may even suggest the stock market has bottomed. What may be even more interesting is that the S&P 500 may be following the KOSPI’s lead higher, as the two begin to diverge.

KOSPI
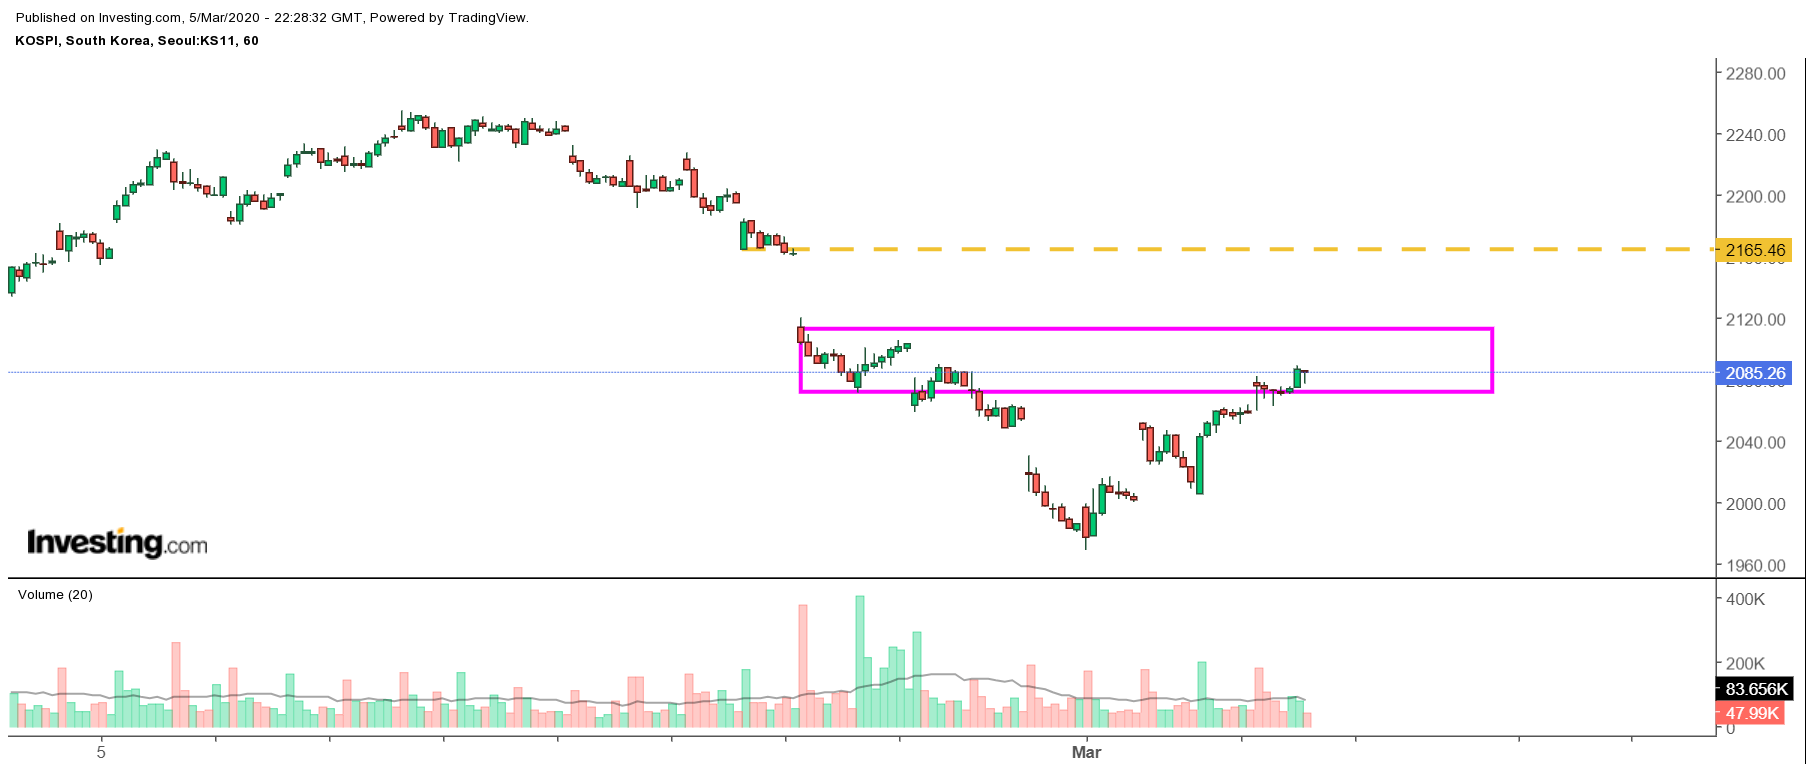
The KOSPI has fallen by roughly 13.5% from its high on Jan. 20 through March 2. But since March 2, the index has risen sharply, by almost 5%. Now, riding an uptrend, the index is attempting to push even higher, and take out a region of resistance that rest around 2,110. Should the KOSPI rise above that level, it could send the index back to almost 2,165 and a gain of roughly 4%.

The improving KOSPI shouldn’t go unnoticed by investors, because it could be an indication that perhaps conditions are improving or perceived to be improving among investors in that market. Should the KOSPI continue to rise, it could eventually spill over to stocks here in the U.S.
Likewise, if investors in South Korea saw the situation as growing worse or not improving, one would think that the market would either not be rebounding or would be making new lows daily. That is not what is happening.
Diverging Trends
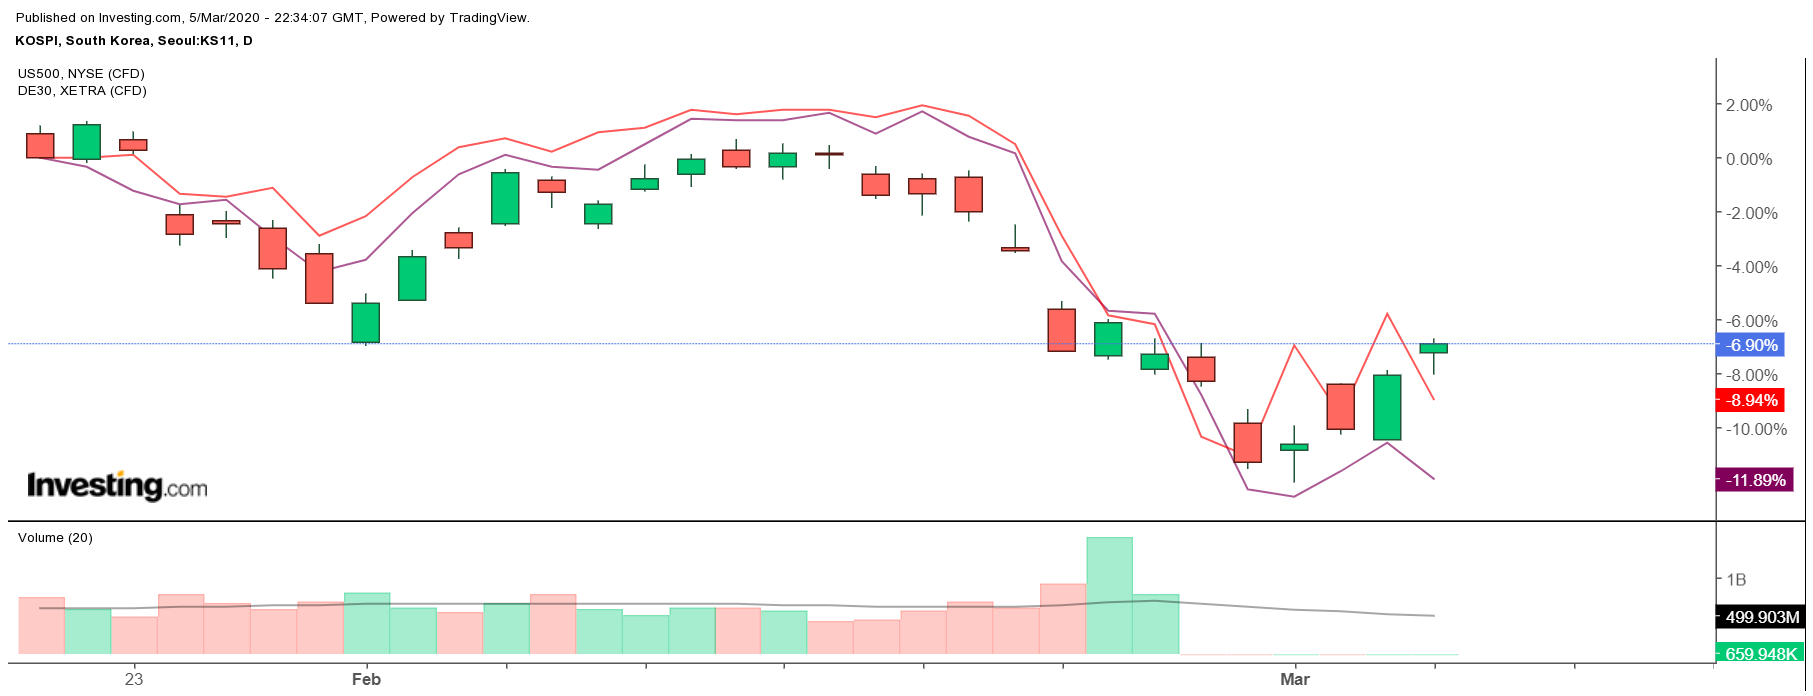
Since bottoming on March 2, the KOSPI has been steadily trending higher while the S&P 500 has been trading in a sideways pattern, while the German DAX continues to flatline along the bottom. However, as the chart shows, the KOSPI is beginning to diverge from the other two indexes and could be signaling that a reversal in the S&P 500 and DAX will soon follow.
Bottoming Process?
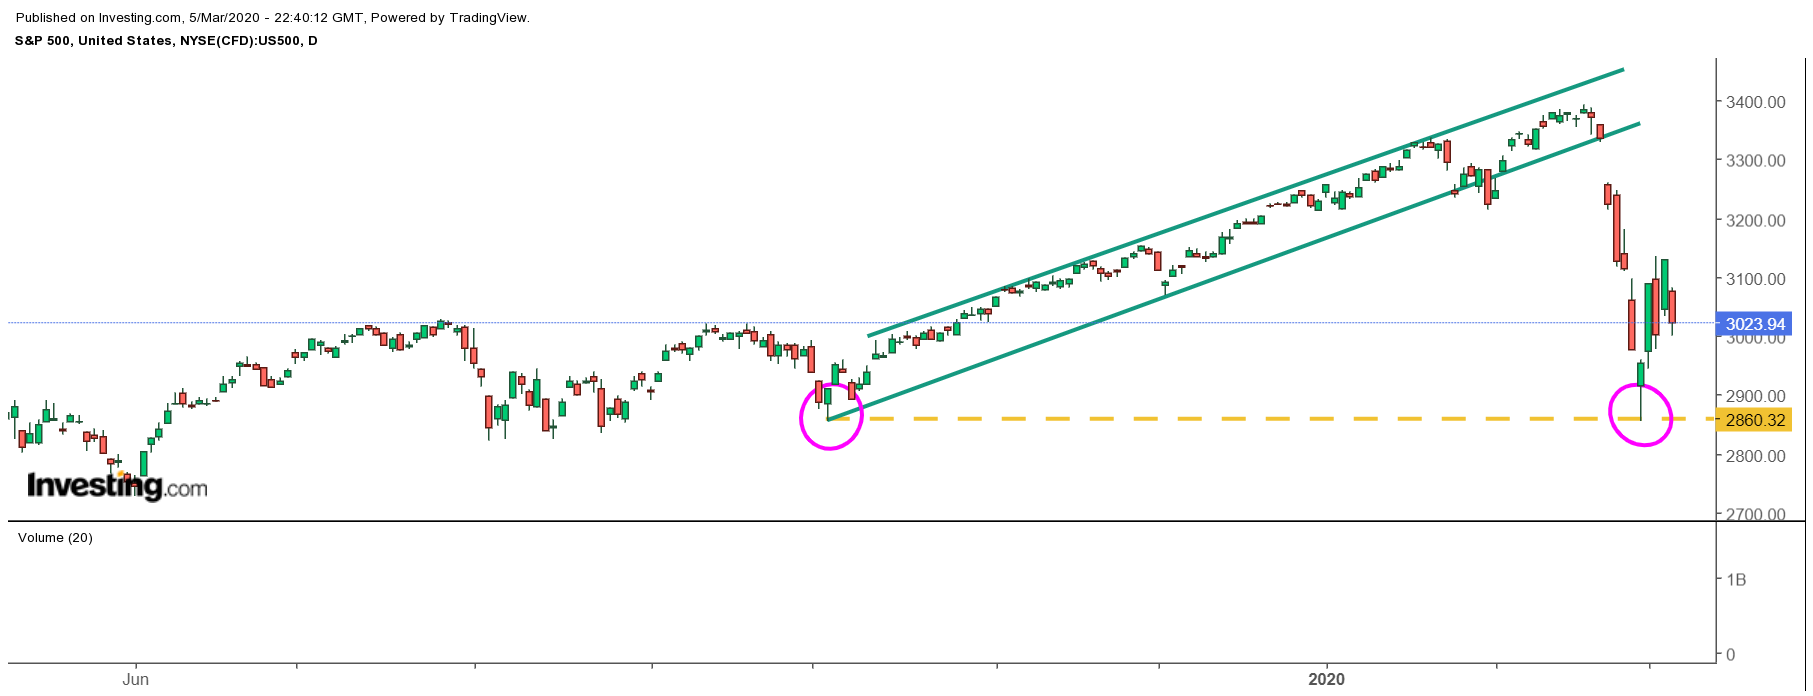
The S&P 500, on the other hand, continues to trade in an extensive trading range between 2,950 and 3,130 with no clear sense of direction. It would give the impression that the market is directionless at this point and is either in the process of forming a bottom or preparing for its next leg lower.
The view that the market will continue to head lower seems to come in contrast to what we see in Korea. Additionally, there appears to be a reasonable chance the S&P 500 has already formed a bottom on Feb. 28. On that day, the index traded as low as 2,855.84, which is nearly the identical low on Oct. 3, 2019 of 2,855.94. It seems to be too much of a coincidence to be by chance; it was effectively the very starting point of the fourth quarter rally uptrend.

While several indicators would suggest the U.S. markets are oversold, the direction of other markets that have seen the most significant impact may be the best way to measure what happens next.
Nothing in life is for sure, and the market’s most significant challenge during this period is trying to figure out the potential damage the virus may have on the global economy. However, it seems reasonable to use other parts of the world to help in making that assessment.
